The Infrastructure Strategy is closely linked to the Financial Strategy. The Financial Strategy considers affordability for ratepayers and the DCC as a whole. The DCC has attempted to balance the competing tensions of affordability, maintaining assets and investing for the future, while addressing the financial challenges of increasing costs, delivering large capital projects and increasing network renewals. The Financial Strategy provides strategic financial limits for rates and debt and discusses other funding sources. The budgets increase rates and debt requirements, but do not exceed the limits over the next ten years.
Ability to deliver on the planned capital programme
Our planned capital expenditure programme represents a significant uplift from the last 10 year plan, with renewals a key area of focus. The challenge for the DCC will be the ability to deliver this programme, acknowledging that the annual targets are higher than previous achievements, and the lead time for delivery is always longer than anticipated. These risks will be managed through improved forward planning, early contractor engagement, innovative procurement strategies (such as those outlined in SOLGM Agile Procurement in the Water Sector document), and strong disciplines around project management and monitoring to ensure progress is on track.
Covid-19 represents a risk to delaying the planned capital and renewals programme. Planning and design work for the programme is able to progress under any alert level through remote working arrangements. DCC will therefore continue to develop the forward work programme during any ongoing Covid-19 alert level restrictions. However, contractor resources are impacted in alert levels. Reduced productivity is expected in alert levels 2 and 3, and only essential projects can progress under alert level 4. The DCC will work closely with its contracting partners to define essential services and look for opportunities to manage supply chain and programme delivery risks. This is likely to include ensuring diversified supply chains from a geographic and supplier perspective, having strong Covid-19 protocols in place and enhanced workforce and labour planning.
Debt
The use of debt allows the financial burden of new capital expenditure to be spread across a number of financial years, recognising that the expenditure is on intergenerational assets, i.e., the assets have a long life and generate benefits both now and to future generations.
Debt is also used to fund the portion of capital renewals that is not covered by funded depreciation.
In our last 10 year plan, the debt limit was fixed at $350 million. This limit is not sufficient to fund planned investment in capital projects and does not recognise the impact of changing costs and/or activity.
The gross debt limit for this 10 year plan is set as 250% of revenue. This means that our debt level will be responsive to change and will move in line with the level of our activities. This revised debt limit will allow flexibility to deliver the planned capital expenditure programme, while also having capacity to fund potential unplanned events.
This debt limit is considered financially prudent, as it sits within the lending limits set by the Local Government Funding Authority (LGFA). The LGFA equivalent metric is based on net debt, where net debt is defined as gross debt less liquid financial assets and investments.
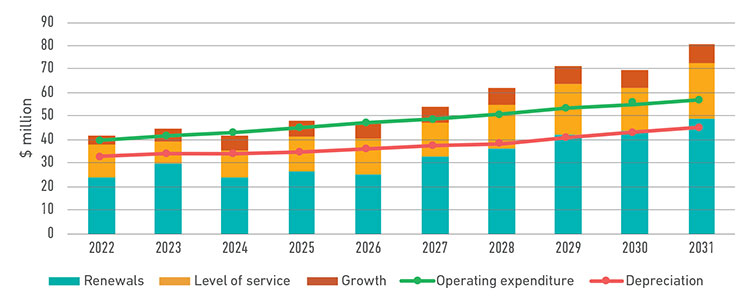
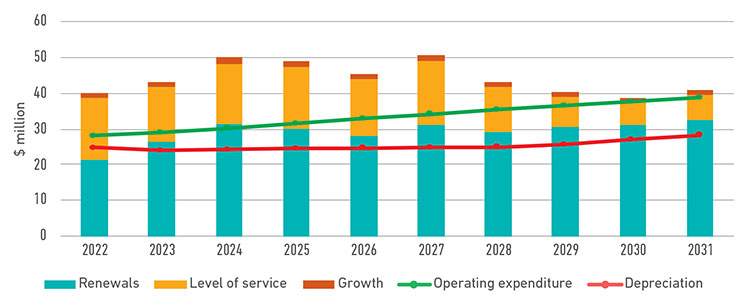
This section shows the planned capital, operating expenditure and depreciation for the first ten years.
Inflation
Inflation has been applied to the capital estimates in line with the DCC’s significant forecasting assumptions adopted for the 10 year plan 2021-31, and extrapolated out across the 50 year period of this strategy.
-
Three waters budget

3 Waters capital and operating expenditure budget
$ million 2022 2023 2024 2025 2026 2027 2028 2029 2030 2031 Total Operating expenditure 40.4 41.6 43.1 44.9 46.9 48.6 50.8 53.3 55.4 57.7 482.7 Depreciation 32.8 34.2 34.4 35.6 37.2 38.6 39.7 42.0 44.2 46.2 384.6 Total operating expenditure 73.1 75.8 77.5 80.6 84.1 87.2 90.4 95.3 99.5 103.8 867.3 Renewals 24.1 29.9 23.9 26.7 25.2 32.9 36.4 42.0 43.9 48.8 333.7 Level of service 14.0 9.4 11.3 14.8 15.5 14.2 18.3 21.7 18.2 23.8 161.2 Growth 3.7 5.6 6.4 6.5 6.9 6.9 7.3 7.8 7.4 8.2 66.8 Total capital expenditure 41.8 44.9 41.6 48.0 47.5 54.0 62.0 71.5 69.5 80.9 561.7 -
Transport Budget

Roading and footpaths capital and operating expenditure budget
$ Million 2022 2023 2024 2025 2026 2027 2028 2029 2030 2031 Total Operating expenditure 28.3 28.9 30.2 31.5 32.8 34.1 35.3 36.4 37.5 38.6 333.6 Depreciation 25.0 24.2 24.4 24.6 24.6 24.9 25.0 25.7 27.0 28.3 253.7 Total operating expenditure 53.2 53.1 54.6 56.1 57.4 59.0 60.3 62.1 64.6 66.9 587.3 Renewals 21.4 26.3 31.4 30.0 28.1 31.1 29.3 30.5 31.0 32.4 291.5 Level of service 17.2 15.2 16.7 17.1 15.6 17.6 12.3 8.5 6.5 7.1 133.8 Growth 1.4 1.5 1.8 1.7 1.5 1.6 1.4 1.2 1.2 1.2 14.4 Total capital expenditure 40.0 43.0 49.8 48.9 45.2 50.4 43.0 40.1 38.6 40.7 439.6

