The impact of both models on rates and charges, debt, borrowing capacity and long-term sustainability has been evaluated. We have assessed whether the two delivery models are financially sustainable and capable of meeting Ōtepoti Dunedin's water services delivery needs without compromising service levels or financial stability.
Please note that this financial assessment is based on several key assumptions. Each model uses a different funding approach which has different financial outcomes. |
|---|
In summary
The in-house model replicates the DCC’s draft 9 year plan (9yp). The CCO model is based on both the Department of Internal Affairs’ guidance and the 9yp information. The CCO model would charge less and borrow more to do the same amount of work.
The CCO has higher borrowing capacity than the in-house model. The financial modelling assumes that there will be the same level of spending on water services delivery under both models.
The figures below are from financial forecasting for the 10 years 2024-2034.
| In-house | CCO | |
|---|---|---|
Rates and Charges | Requires $114 million more in water charges than the CCO model over 10 years to 2034. Annual increases are higher in the first three years to 2027/28. | Requires $114 million less in water charges than the in-house model over 10 years to 2034. Accomplished by debt funding. After the first three years, annual increases are higher compared to the in-house model. |
| Debt | Debt is $157 million lower than the CCO model by 2034. This is because the in-house model will charge more. | Debt is $157 million higher than the in-house model by 2034. This is because the CCO model will charge less. |
| Borrowing capacity | The capacity to borrow is lower than the CCO model. | The CCO can borrow more than the in-house model. |
| Interest costs | Lower debt means $35 million less in interest costs over 10 years than the CCO model. | Higher debt means $35 million more in interest costs over 10 years than the in-house model. |
| Additional expenditure | Additional costs required to comply with regulatory and ringfencing requirements. | Additional costs required to comply with regulatory, ringfencing and CCO-related operational costs. Estimated to be $9 million higher than in-house option. There will also be transitional costs to establish the CCO, which are yet to be determined. |
Rates and charges
| In-house | CCO | Summary |
|---|---|---|
The DCC currently retains the ability to determine how water services are charged, whether through rates, fixed charges, or volumetric pricing (charges based on the amount you use). The draft 9-year plan budget provides 15% per annum rate increases for the first three years leading to a balanced budget (for water services) by the 2027/28 year. Cumulative increases in water charges are expected to reach 143% by 2033/34. In the 2033/34 year, total water services revenue from rates and charges is $198 million. Requires $114 million more in water charges over 10 years than the CCO model. | The Local Government (Water Services) Bill requires that CCOs transition to charging that is not based on property valuation within five years of establishment, although allows flexibility for the CCO to collect charges via DCC rates. This change could shift costs more directly to users based on consumption, potentially increasing costs for higher water users while benefiting those with lower usage. Annual water charge increases are comparatively lower until the 2027/28 year. From then onwards, annual increases are higher than the in-house model, as debt and therefore interest costs increase. Cumulative increases in water charges are expected to reach 139% by 2033/34. In the 2033/34 year, total revenue is $194 million. Requires $114 million less in water charges over 10 years than the in-house model because the CCO borrows more for capital expenditure. | Both models are projected to be financially sustainable over the period modelled. The CCO model may result in more noticeable changes for customers due to the required shift away from using property valuations for charging. The CCO model results in lower charges for customers over the period modelled. However, by year 10, the gap between the two models closes. |
Rates and charges compared
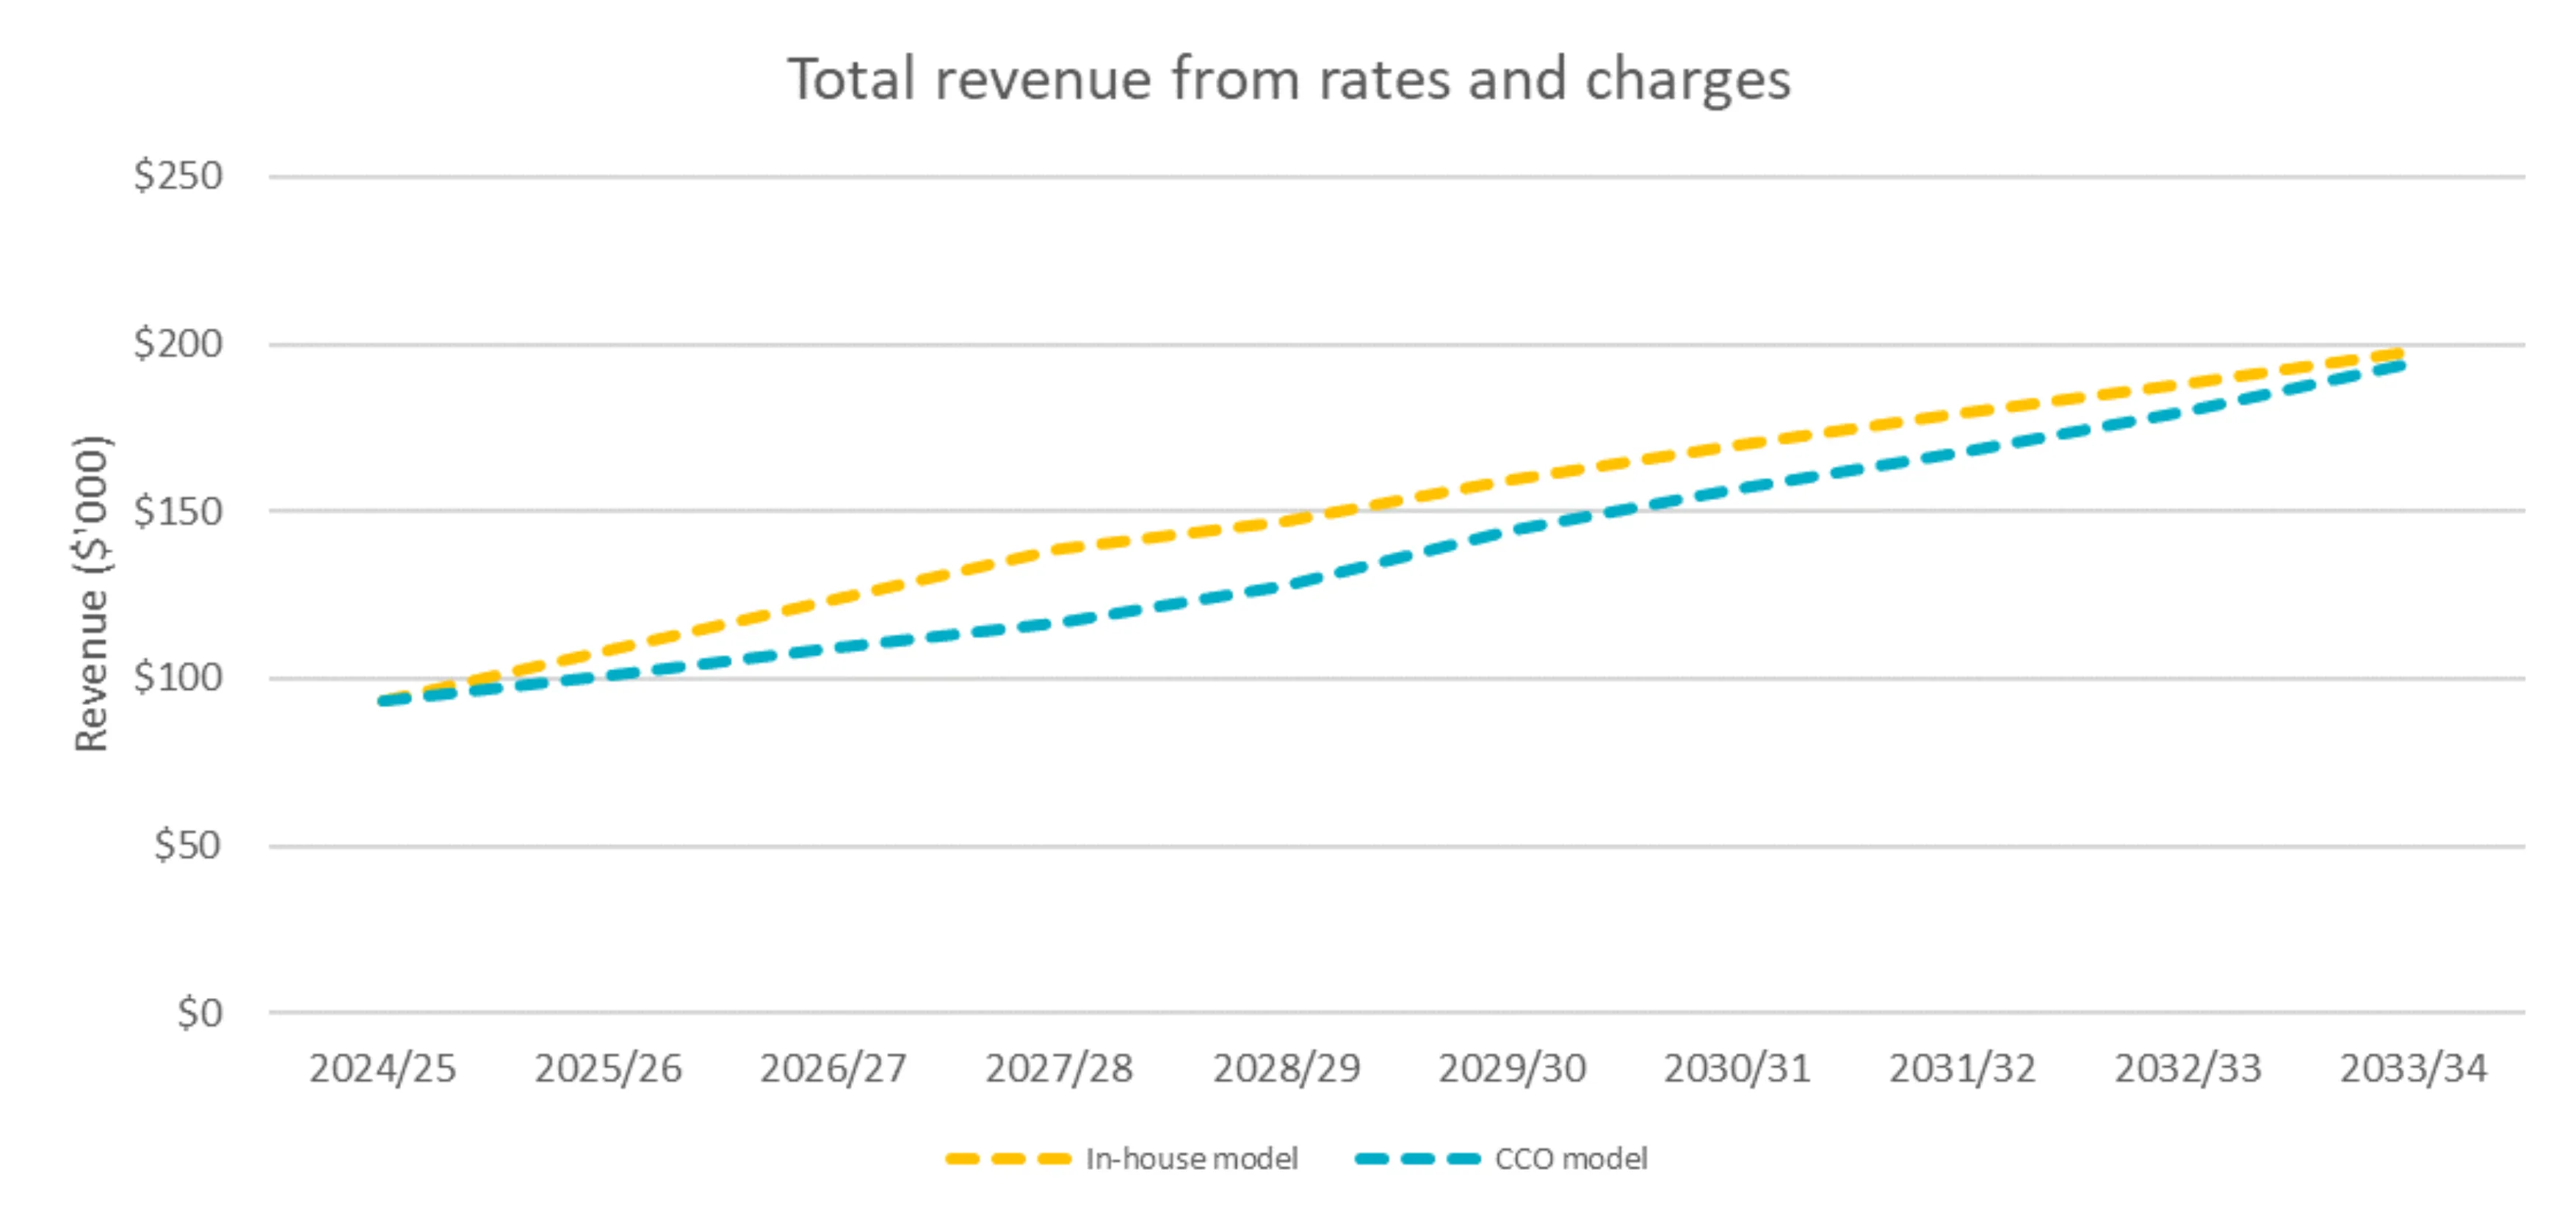
Total revenue from rates and charges for each model is shown in the chart below. In the 2033/34 year, total revenue is $198 million in the in-house model and $194 million in the CCO model.
-
Total revenue from rates and charges
2024/25 2025/26 2026/27 2027/28 2028/29 2029/30 2030/31 2031/32 2032/33 2033/34 In-house model $93 $109 $123 $139 $147 $159 $170 $179 $188 $198 CCO model $93 $101 $109 $117 $128 $144 $157 $168 $180 $194
Average charge per connection compared
The chart below shows what an average per connection charge could be under both options. The “per connection charge” includes all connections (including households and businesses). While this does not reflect the current charging model, it provides a comparison of the direction charges are likely to go.
This charge is simply the total amount of rates revenue required each year divided by the number of connections. For all connections (which includes households and businesses), the annual per connection charge over the next 9 years is forecast to increase from $2024 to $4280 under the in-house model and from $2024 to $4202 under the CCO model.

-
Average charge per connection (including GST)
2024/25 2025/26 2026/27 2027/28 2028/29 2029/30 2030/31 2031/32 2032/33 2033/34 Total In-house model $2,024 $2,314 $2,654 $3,029 $3,194 $3,469 $3,687 $3,885 $4,076 $4,280 $32,611 CCO model $2,024 $2,142 $2,329 $2,519 $2,755 $3,117 $3,388 $3,617 $3,882 $4,202 $29,975 Difference $0 $172 $325 $510 $438 $352 $299 $268 $194 $78 $2,635
Annual increases in charges compared
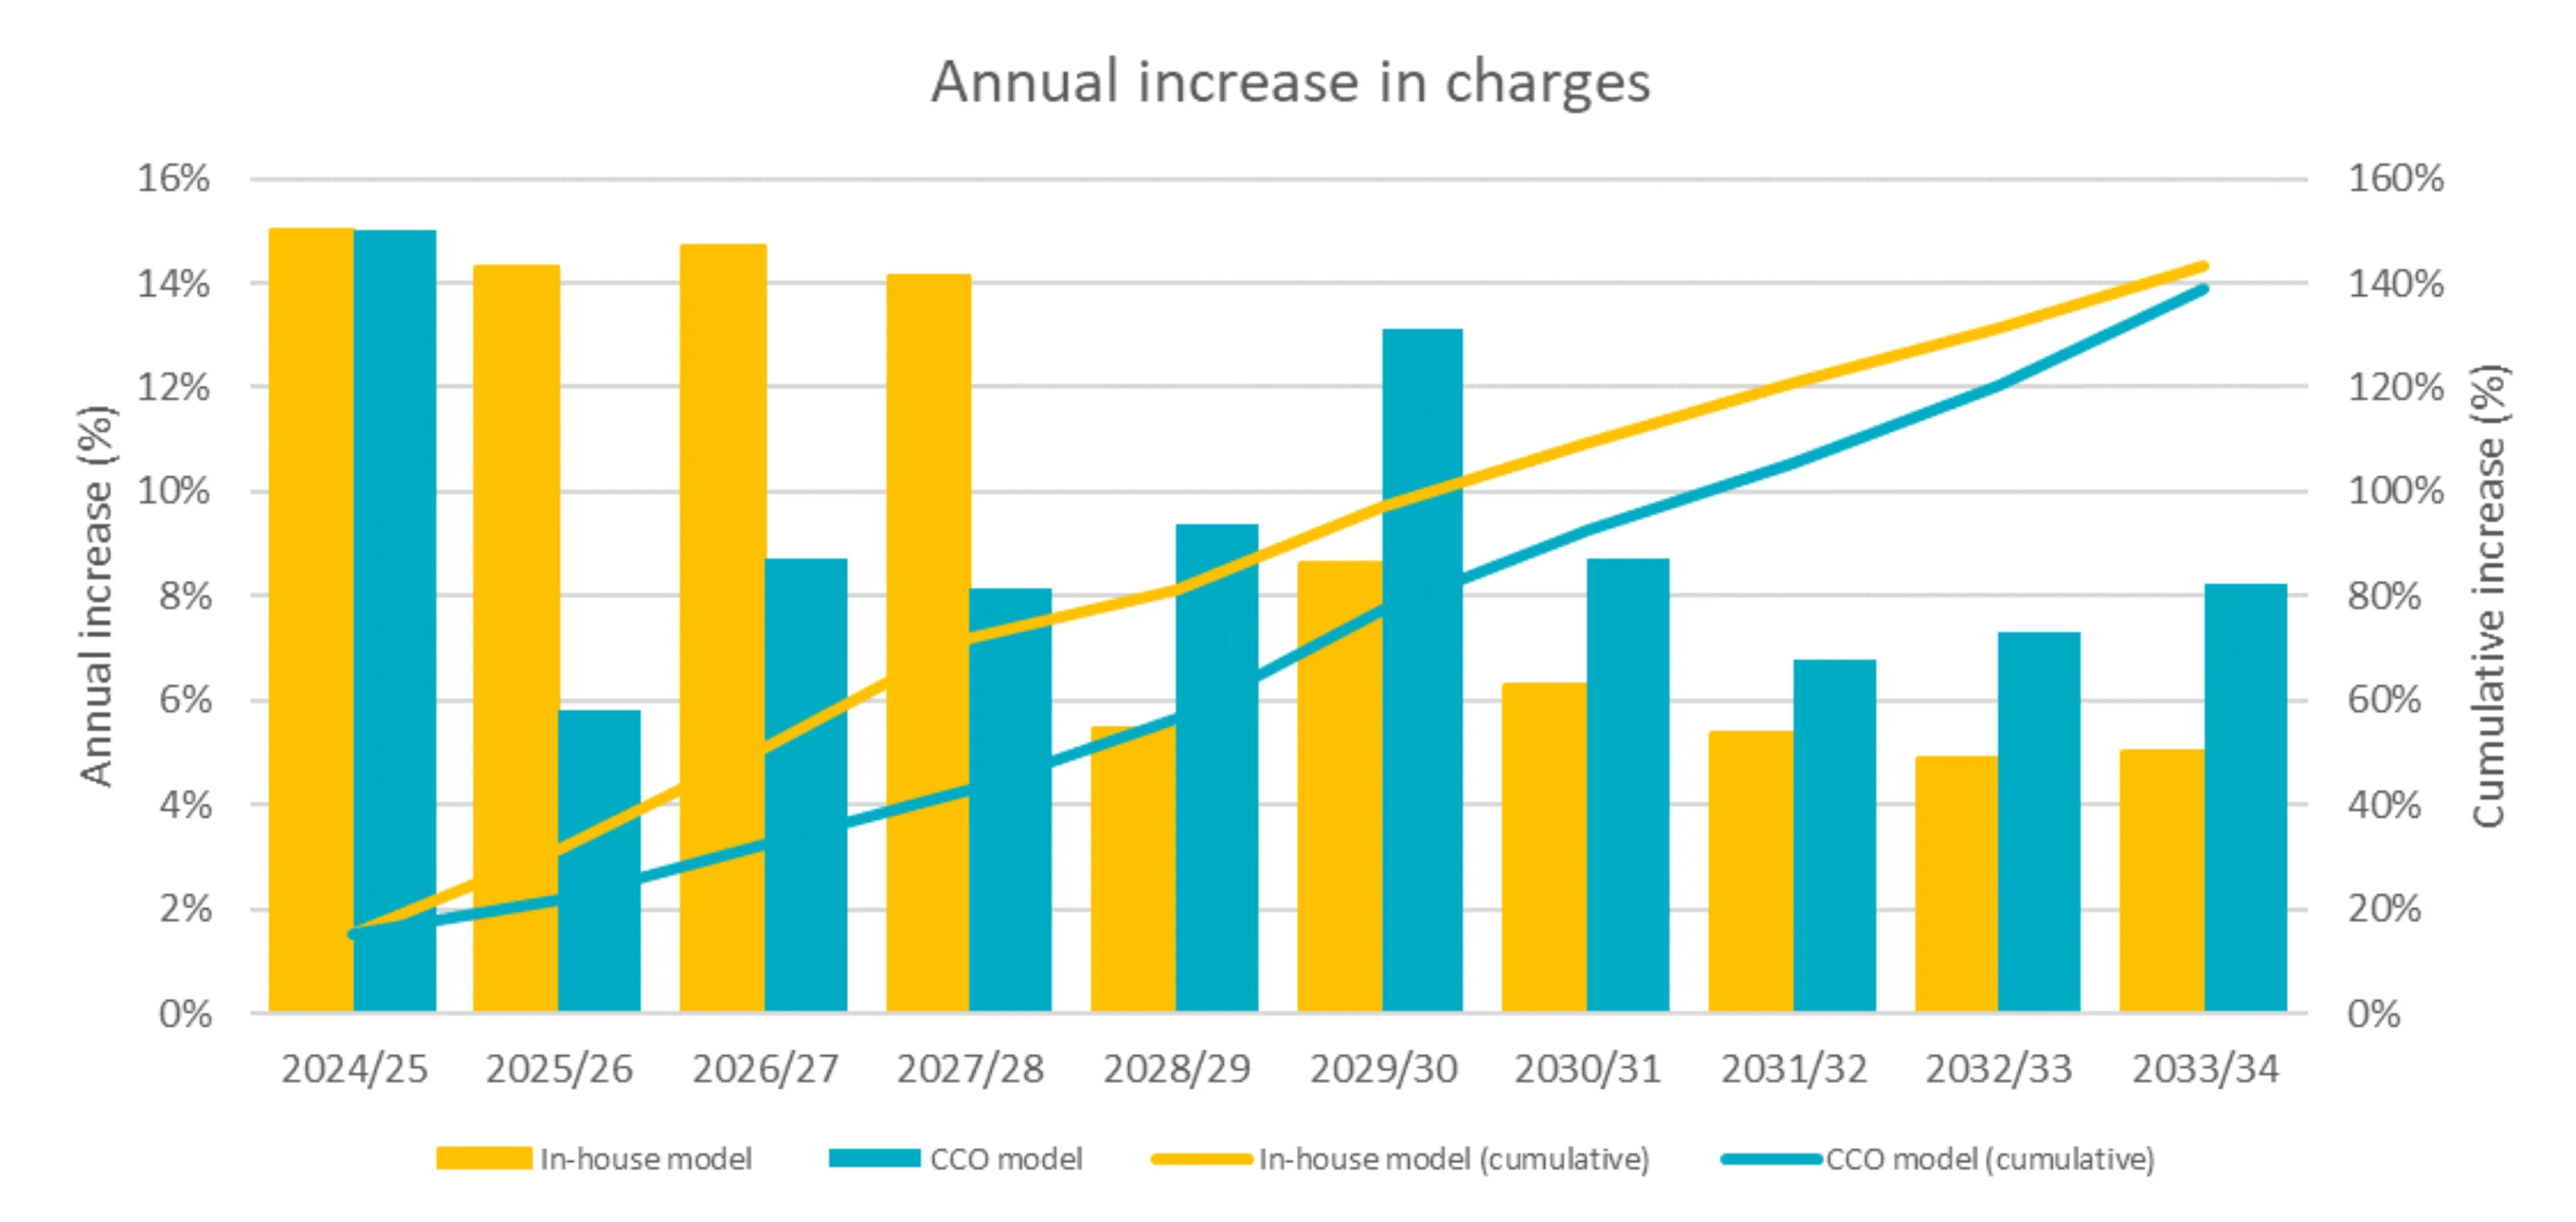
Annual increases in charges for water services are higher for the in-house model for the three-year period from 2025/26 to 2027/28. From the 2028/29 year, the annual increases in charges are higher in the CCO model. Cumulative increases in water charges are expected to reach 143% by 2033/34 for the in-house model and 139% for the CCO model. This is illustrated in the chart below.
-
Annual increase in charges
2024/25 2025/26 2026/27 2027/28 2028/29 2029/30 2030/31 2031/32 2032/33 2033/34 In-house model 15.0% 14.3% 14.7% 14.1% 5.4% 8.6% 6.3% 5.4% 4.9% 5.0% CCO model 15.0% 5.8% 8.7% 8.2% 9.4% 13.1% 8.7% 6.8% 7.3% 8.3%
Household charges compared
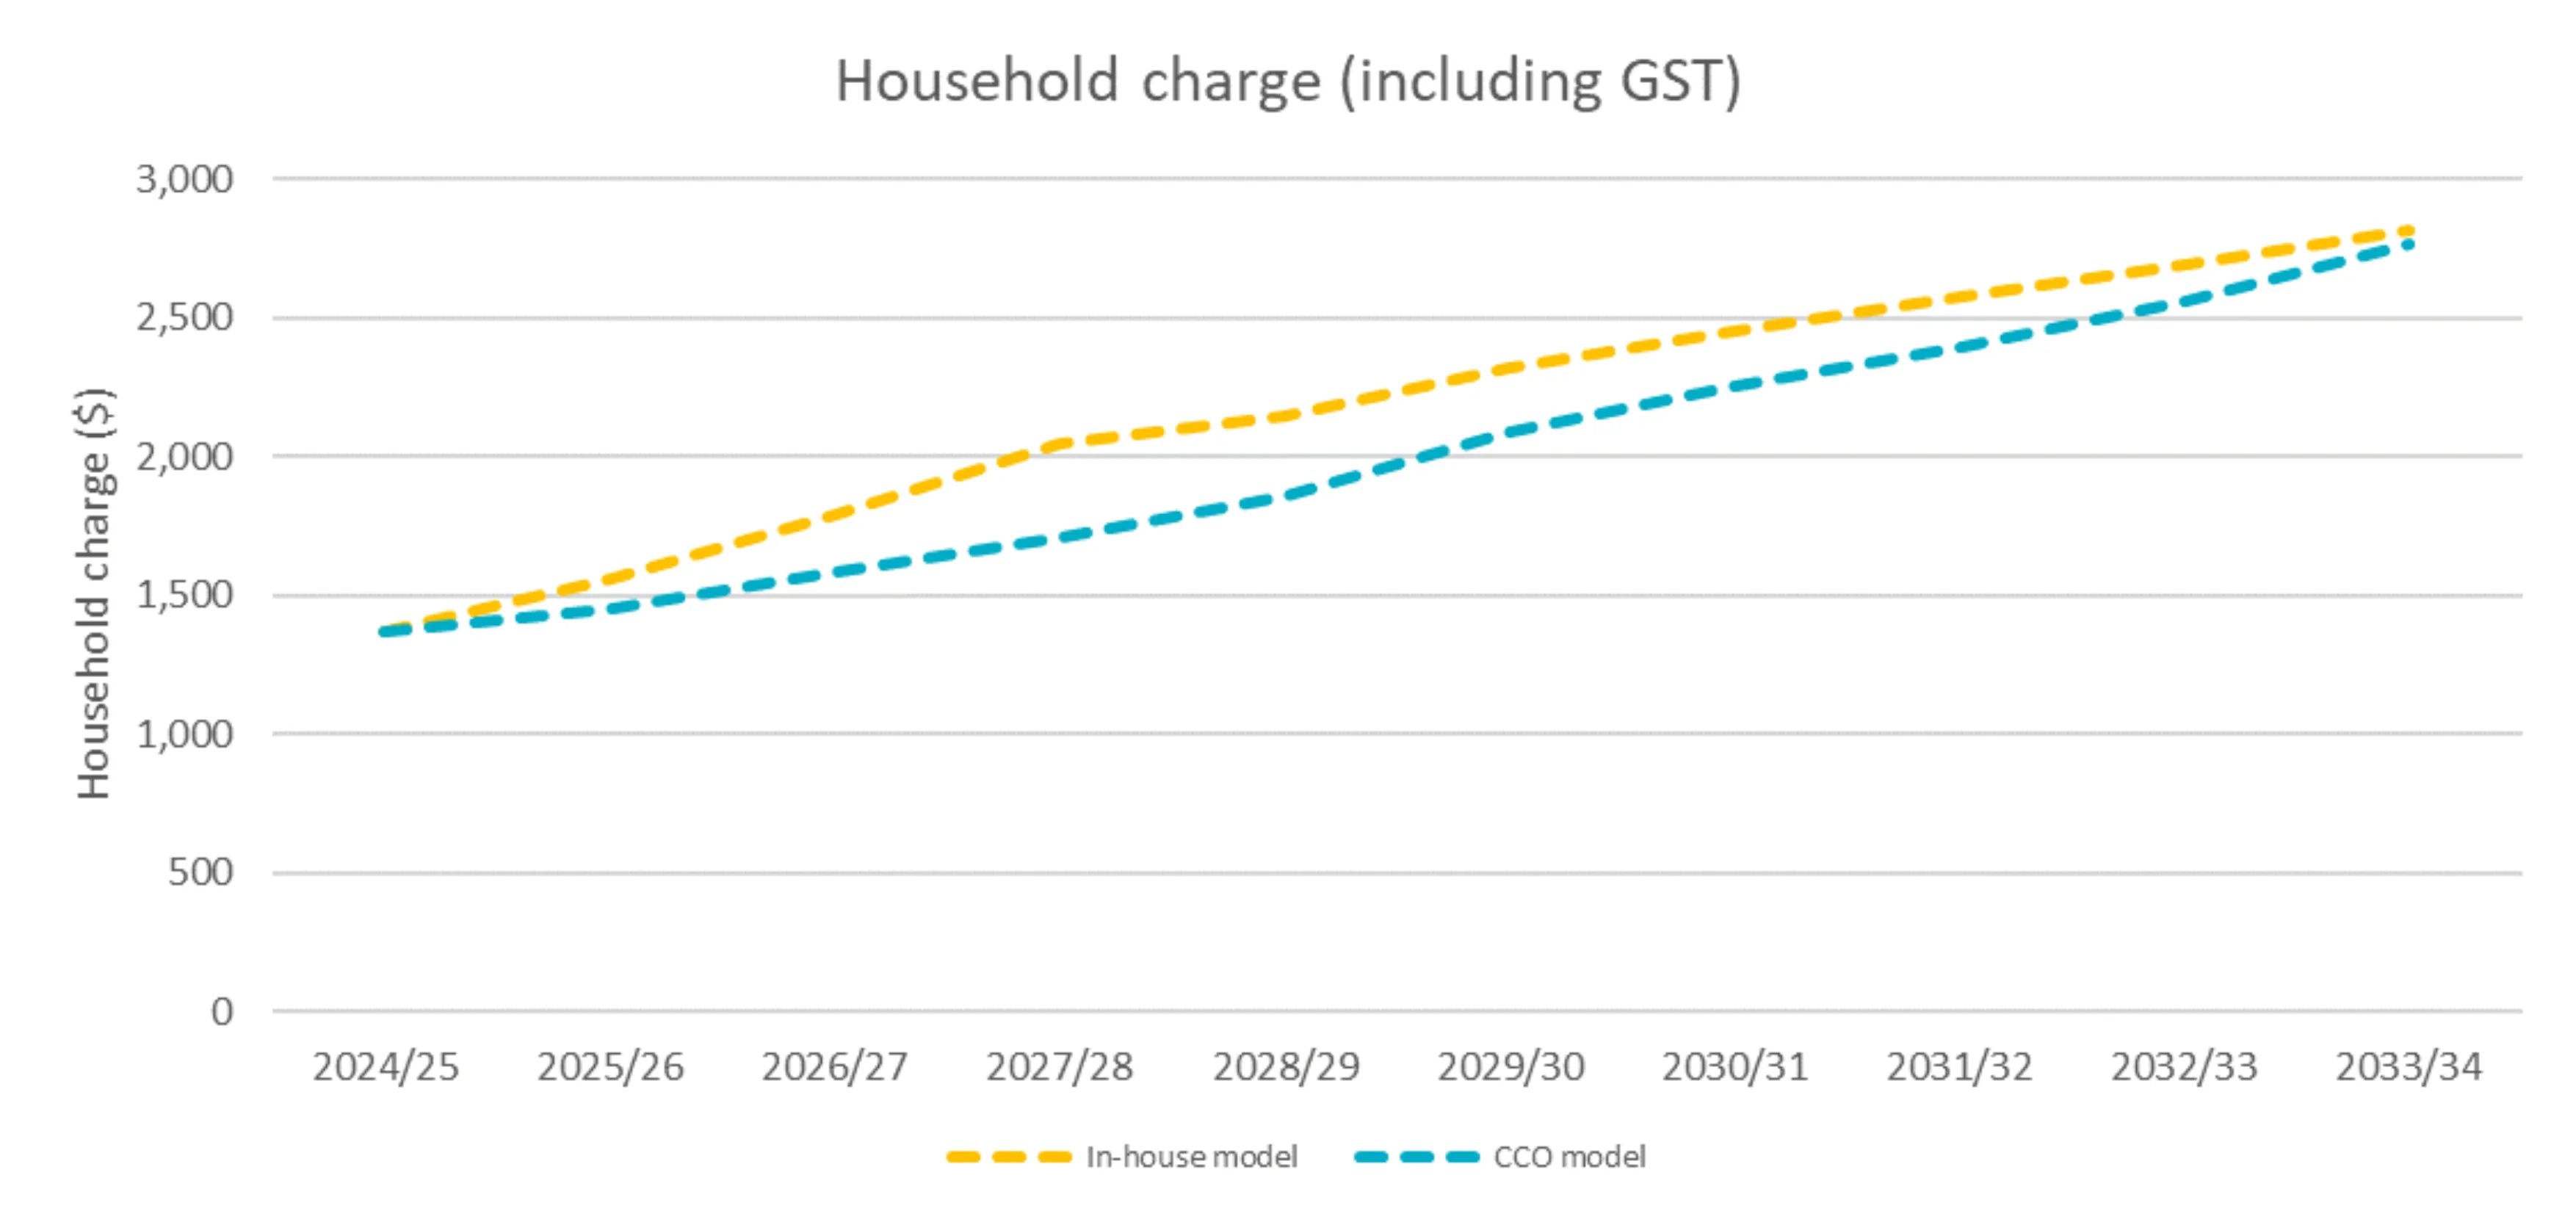
The following chart shows what household charges could be under both options. While this does reflect the current charging model for residential properties, it may not be the charging model used by the CCO. Again, it provides a comparison of the direction charges are likely to go. The average charge per household is lower in the CCO model; however, the difference (saving) reduces as more debt is raised.
-
Household charges (including GST)
2024/25 2025/26 2026/27 2027/28 2028/29 2029/30 2030/31 2031/32 2032/33 2033/34 In-house model $1,366 $1,559 $1,790 $2,043 $2,146 $2,318 $2,452 $2,572 $2,688 $2,814 CCO model $1,366 $1,453 $1,580 $1,708 $1,856 $2,085 $2,253 $2,395 $2,562 $2,765
Sample charges, for a range of rating valuations, for commercial properties, are provided in the 'Our finances' section of the draft 9 year plan 2025-34.
Debt
| In-house | CCO | Summary |
|---|---|---|
Operates within DCC’s borrowing limit and the Local Government Funding Agency (LGFA) borrowing limit of 280% of revenue. The draft 9-year plan budget provides sufficient borrowing headroom below this limit, providing flexibility to address unforeseen circumstances while funding planned investments. Debt for water services reaches $630 million by 2033/34. Annual interest expense for water services reaches $30 million by 2033/34. DCC will need to monitor Group debt more closely under the | Allows borrowing from LGFA of up to 500% of revenue, significantly increasing the capacity to fund large-scale infrastructure upgrades. This could accelerate the delivery of critical infrastructure but comes with higher debt and therefore higher debt-servicing obligations. Debt reaches $788 million by 2033/34, $157 million higher than the in-house model. Annual interest expense reaches $37 million by 2033/34. | Both models are expected to be financially sustainable over the period modelled. The CCO model offers enhanced borrowing capacity (access to more debt). Both models have sufficient borrowing headroom to achieve the current capital expenditure programme and unforeseen costs. In the CCO option debt-servicing obligations increase with $157 million additional borrowing resulting in $35 million more in interest costs over the 10-year period. Annual interest expense is $7 million higher in the CCO model by 2033/34. DCC will need to monitor Group debt more closely under the |
Under the CCO model, debt is $157 million higher than the in-house model due to less revenue from rates and charges and the additional interest and operating costs. The charts below show the level of debt for water services for each option.
Debt under an in-house model
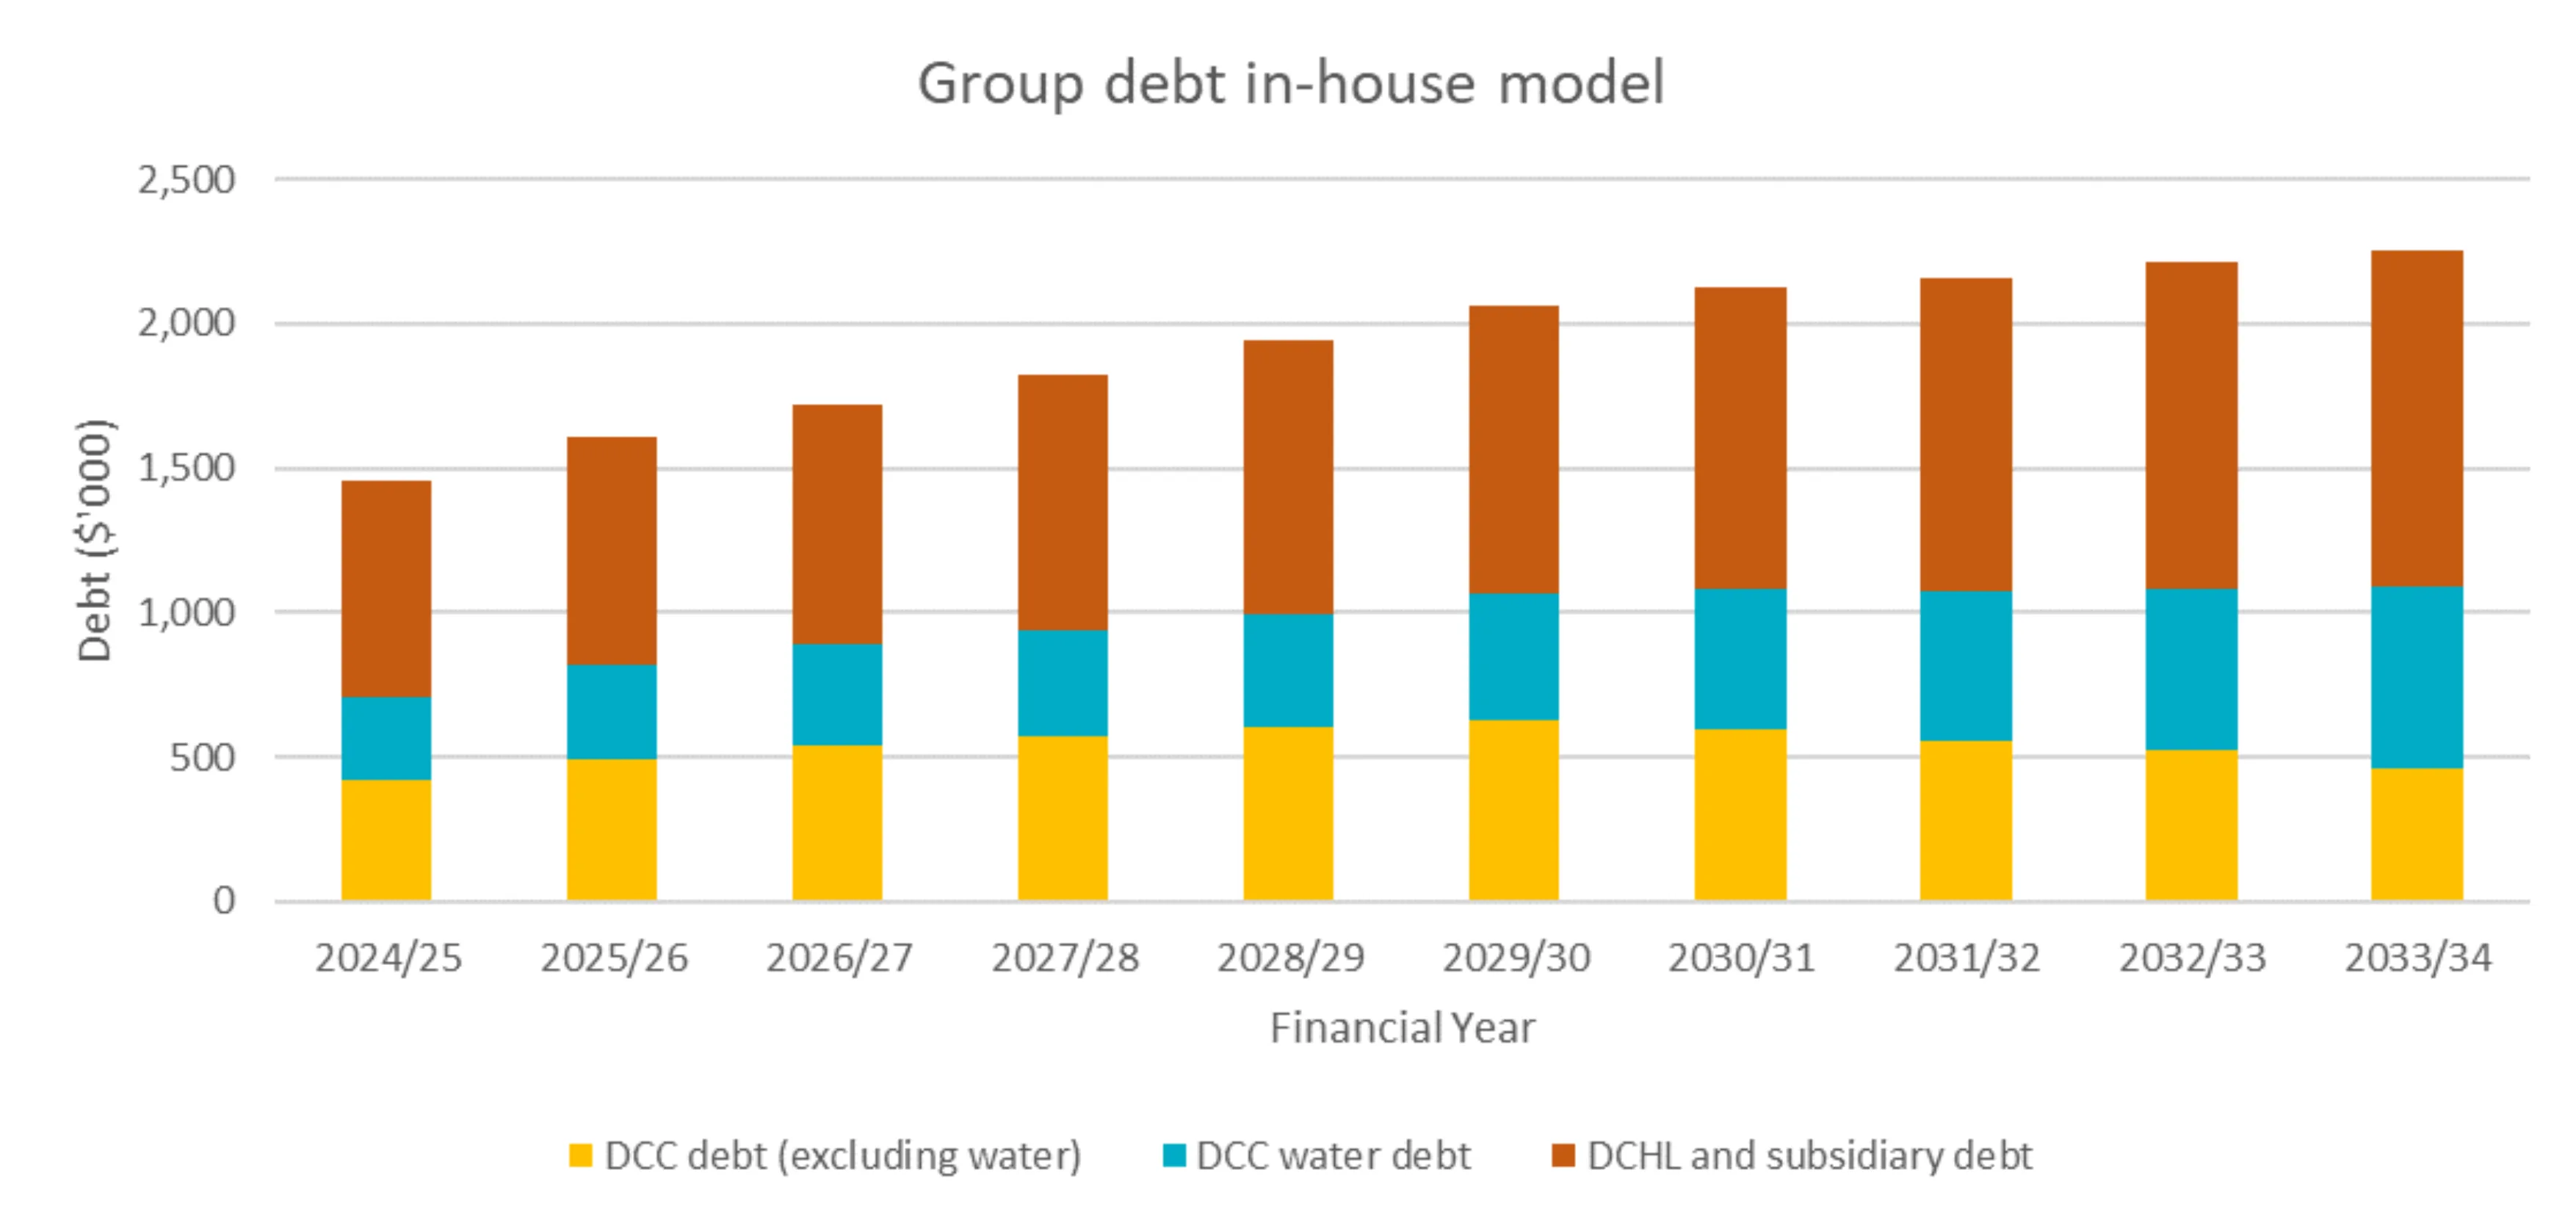
The chart below shows forecast debt levels for the DCC, DCC debt for water services and DCC-owned company debt (Dunedin City Holdings Limited [DCHL] and subsidiaries). Total Group debt forecast by the 2033/34 year is $2.257 billion.
-
Group debt in-house model
2024/25 2025/26 2026/27 2027/28 2028/29 2029/30 2030/31 2031/32 2032/33 2033/34 DCC debt (excluding water) 422 495 540 573 603 630 598 557 523 463 DCC water debt 287 322 350 364 396 437 484 517 562 628 DCHL and subsidiary debt 751 789 832 890 948 995 1,041 1,087 1,128 1,166
Debt under a CCO model
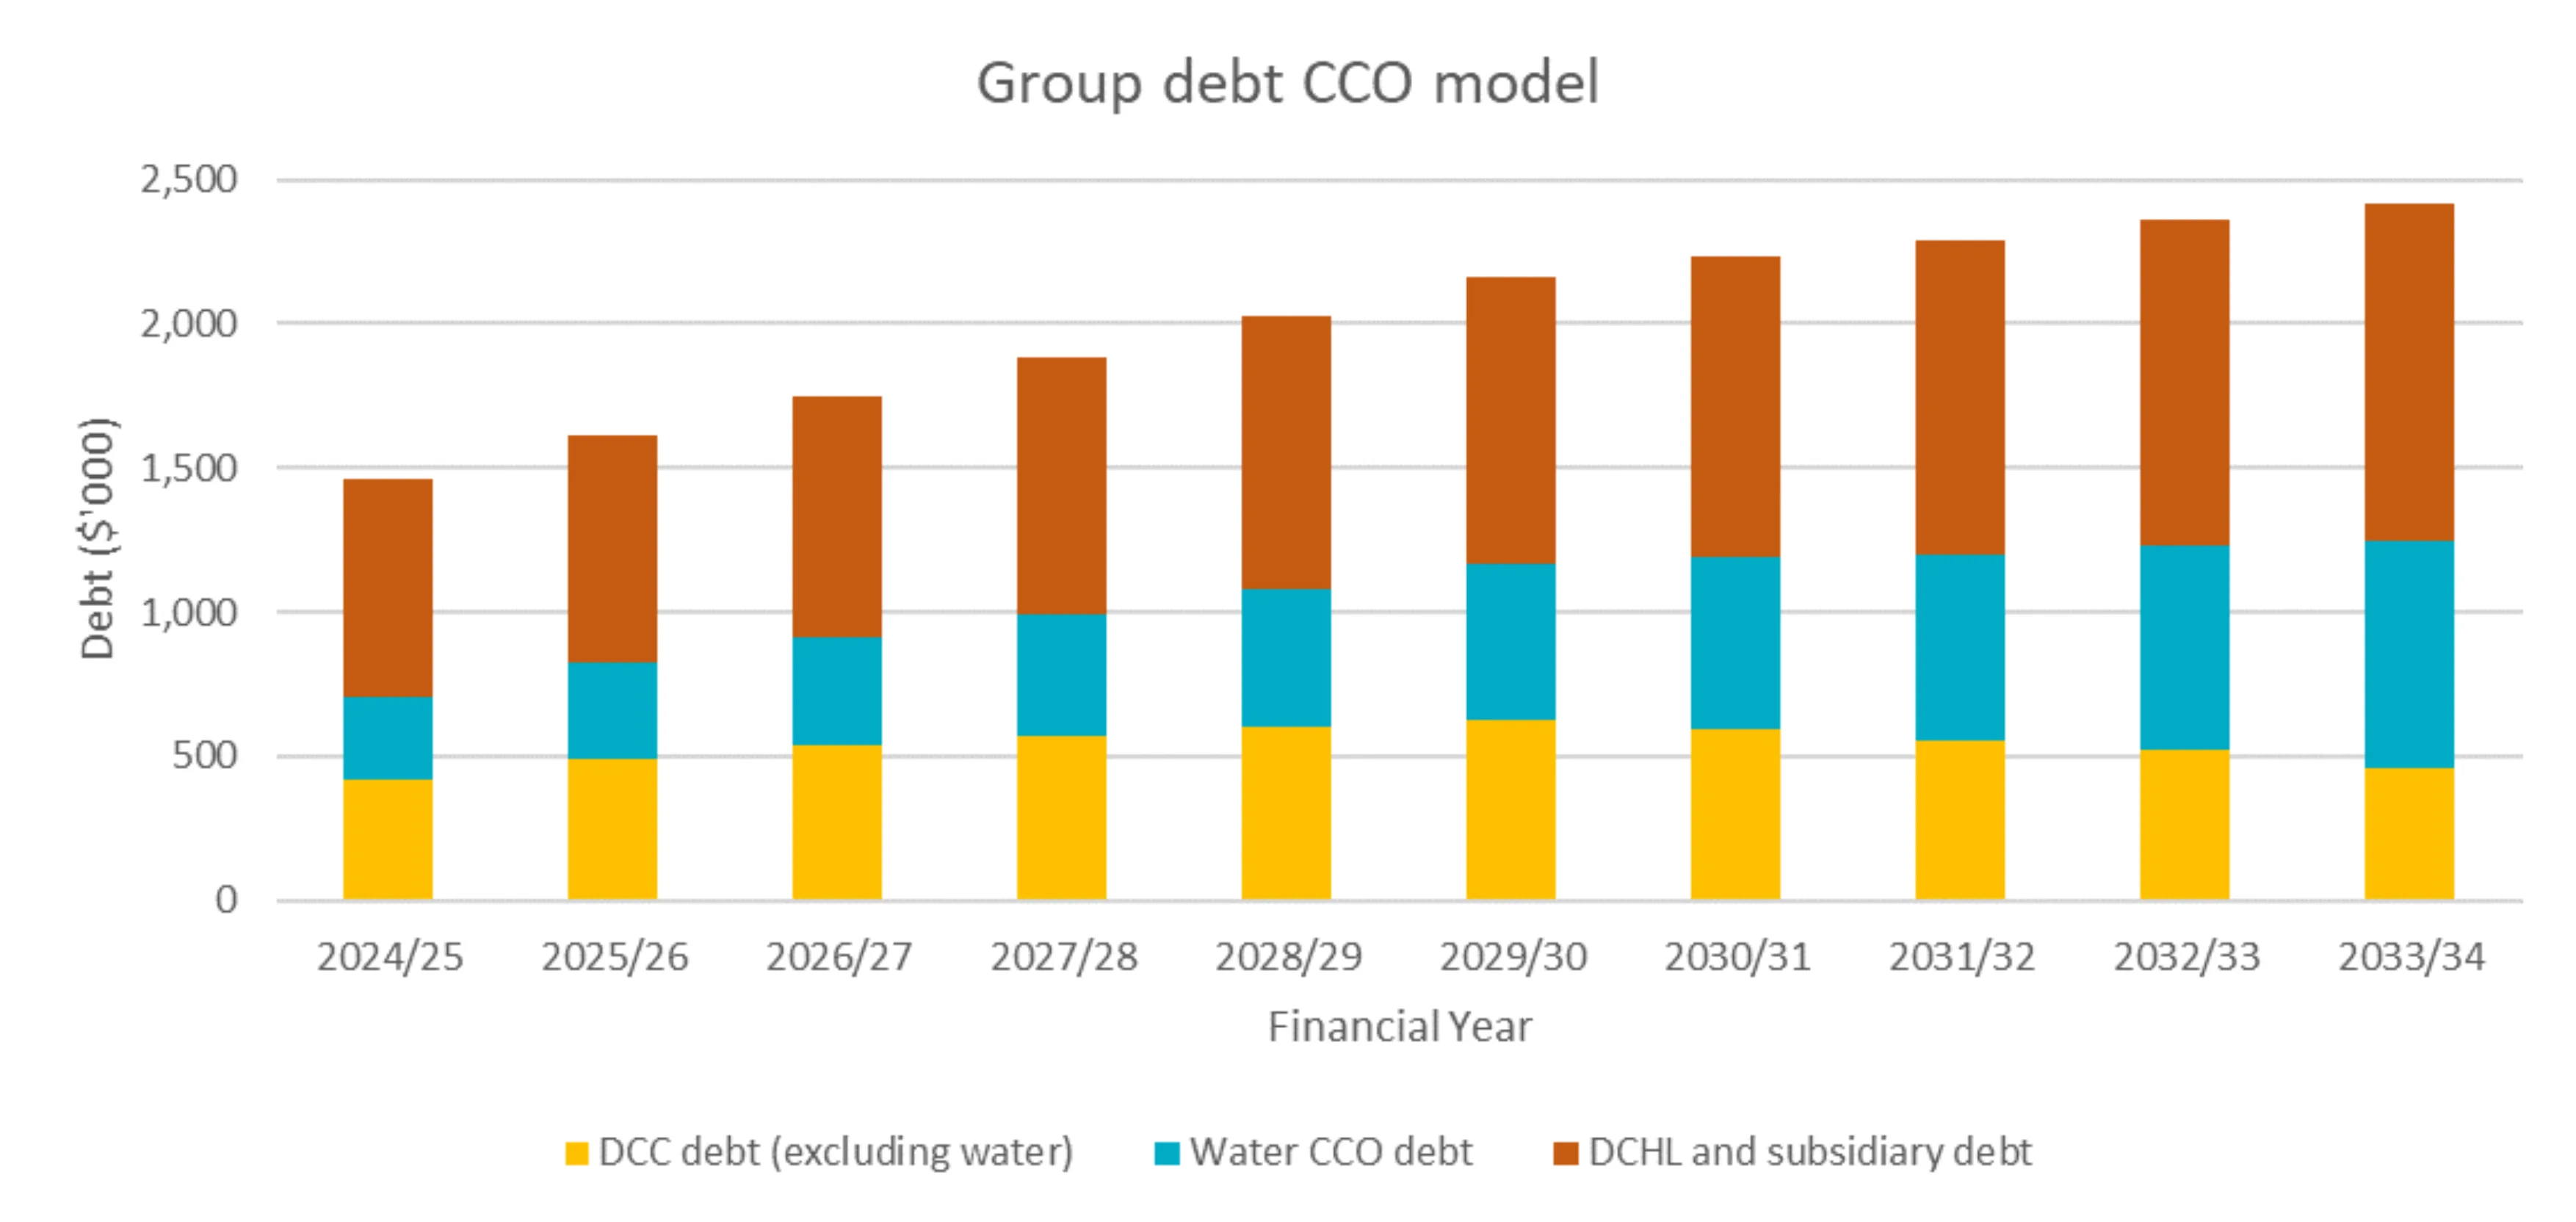
The chart below shows forecast debt levels for the DCC, DCC debt for water services and DCC-owned company debt (DCHL and subsidiaries). Total Group debt forecast by the 2033/34 year is $2.416 billion. This is $157 million higher than the in-house model.
-
Group debt CCO model
2024/25 2025/26 2026/27 2027/28 2028/29 2029/30 2030/31 2031/32 2032/33 2033/34 DCC debt (excluding water) 422 495 540 573 603 630 598 557 523 463 Water CCO debt 287 329 373 418 474 537 596 644 707 788 DCHL and subsidiary debt 751 789 832 890 948 995 1,041 1,087 1,128 1,166
