Ōtepoti Dunedin's Zero Carbon targets
The Dunedin City Council declared a climate emergency in 2019, setting a goal for Ōtepoti Dunedin to become a Zero Carbon city by the year 2030.
There are two overarching targets Dunedin needs to achieve to become a Zero Carbon city:
- Net zero carbon by 2030 (excluding biogenic methane)
- Reducing biogenic emissions
The Zero Carbon Plan maps out the changes that Dunedin needs to become a Zero Carbon city, and what the DCC is doing next to help make that happen.
Net zero carbon by 2030 (excluding biogenic methane)
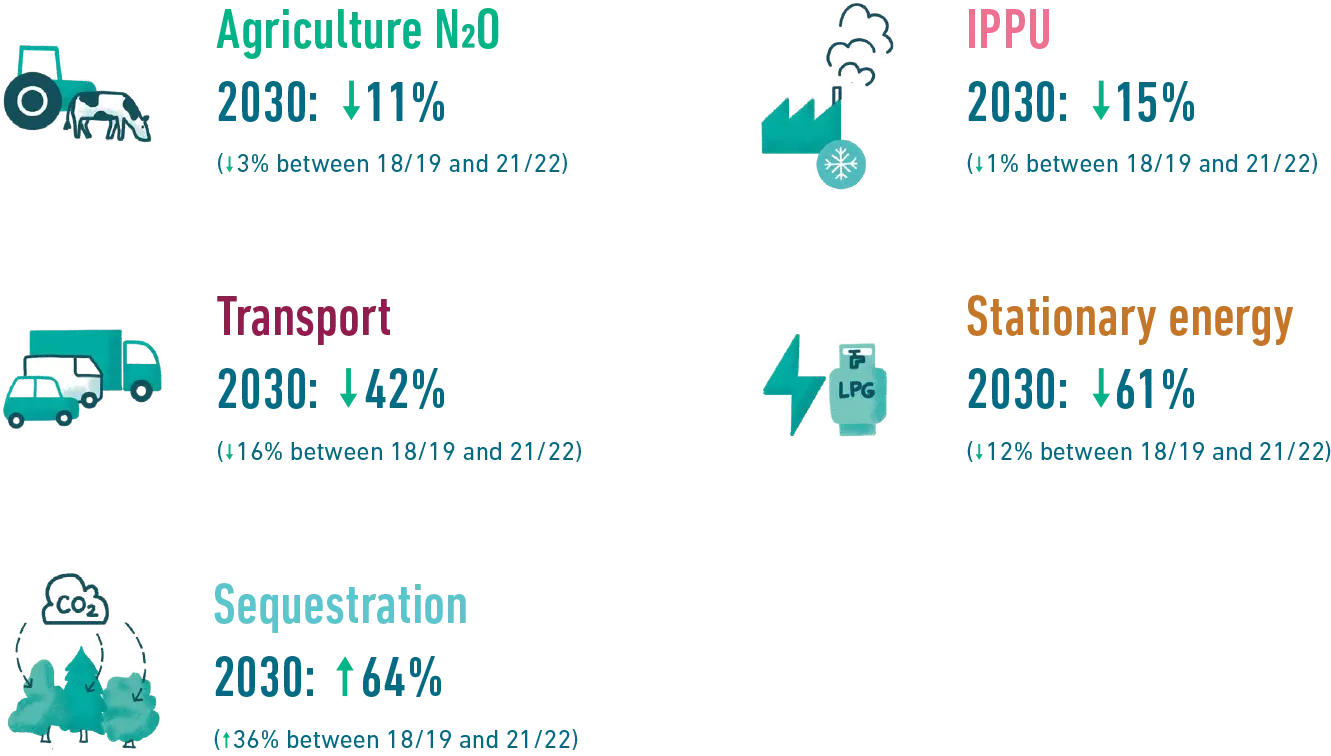
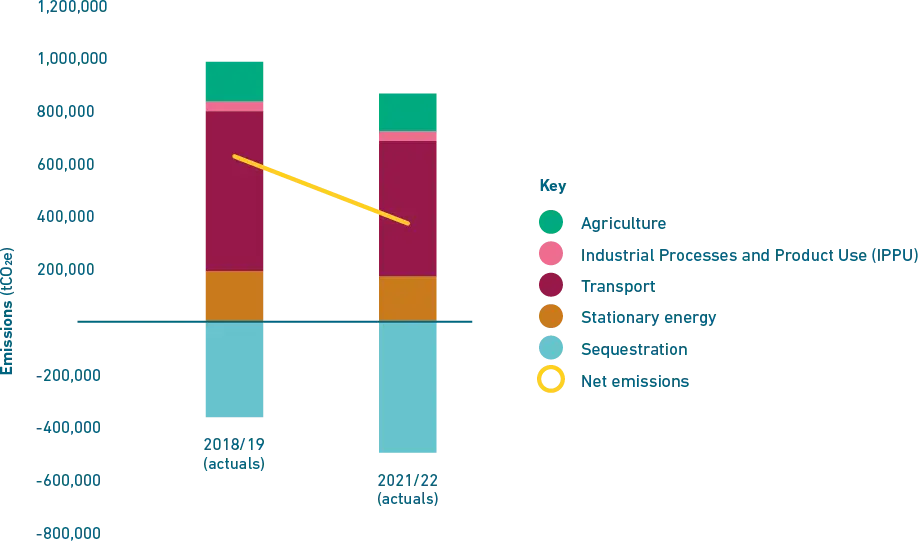
Dunedin can achieve net zero carbon (excluding biogenic methane) through reducing its total emissions by 40% and increasing its carbon sequestration by 64% upon 2018/19 levels. This would require significant reductions in emissions from transport, stationary energy, agriculture, and industrial processes and product use.
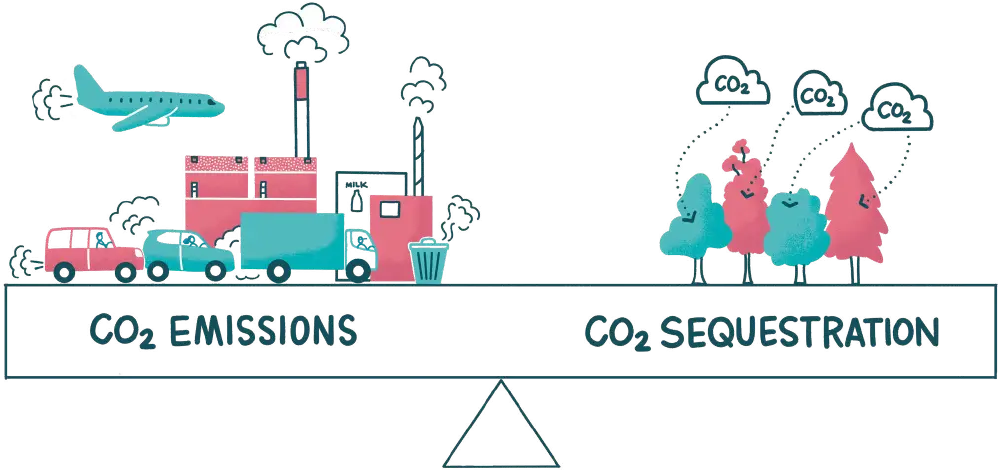
Net zero carbon means that any greenhouse gases (excluding biogenic methane) we emit into the atmosphere in Dunedin are in balance with the amount of carbon absorbed out of the atmosphere by trees, also known as sequestration.

-
Graph data
FINAL ZERO CARBON PLAN MODELLING Actuals Modelled Sector / source 2018-19 2021-22 2024-25 2027-28 2030-31 Net Emissions (exlcuding biogenic methane) Stationary Energy 192,833 176,329 155,090 84,570 75,816 Note to Web team: ignore land, air and marine transport please Land transport 383,479 332,184 321,495 265,759 220,133 Air Transport 30,400 18,717 19,608 20,015 15,091 Marine Transport 194,496 160,389 160,916 143,773 116,664 Transport 608,375 511,290 502,019 429,547 351,888 Industrial Processes and Product Use (IPPU) 37,561 37,027 35,308 33,805 31,927 Agriculture 150,176 143,095 142,125 138,099 134,074 Total sequestration required -361,337 -493,170 -494,235 -494,235 -593,704 Net Emissions excl biogenic methane 627,607 374,572 340,306 191,787 - Gross Emissions excl biogenic methane 988,944 867,741 834,541 686,022 593,704
-
Table data
2030 IPPU -15% (-1% between 18/19 and 21/22) Sequestration 64% (+36% between 18/19 and 21/22) Agriculture N2O -11% (-3% between 18/19 and 21/22) Transport -42% (-16% between 18/19 and 21/22) Stationary energy -61% (-12% between 18/19 and 21/22)
This would require significant reductions in emissions from transport, stationary energy, agriculture and industrial processes. Even with these reductions, Dunedin would still be producing excess emissions that would need to be balanced out by increased sequestration.
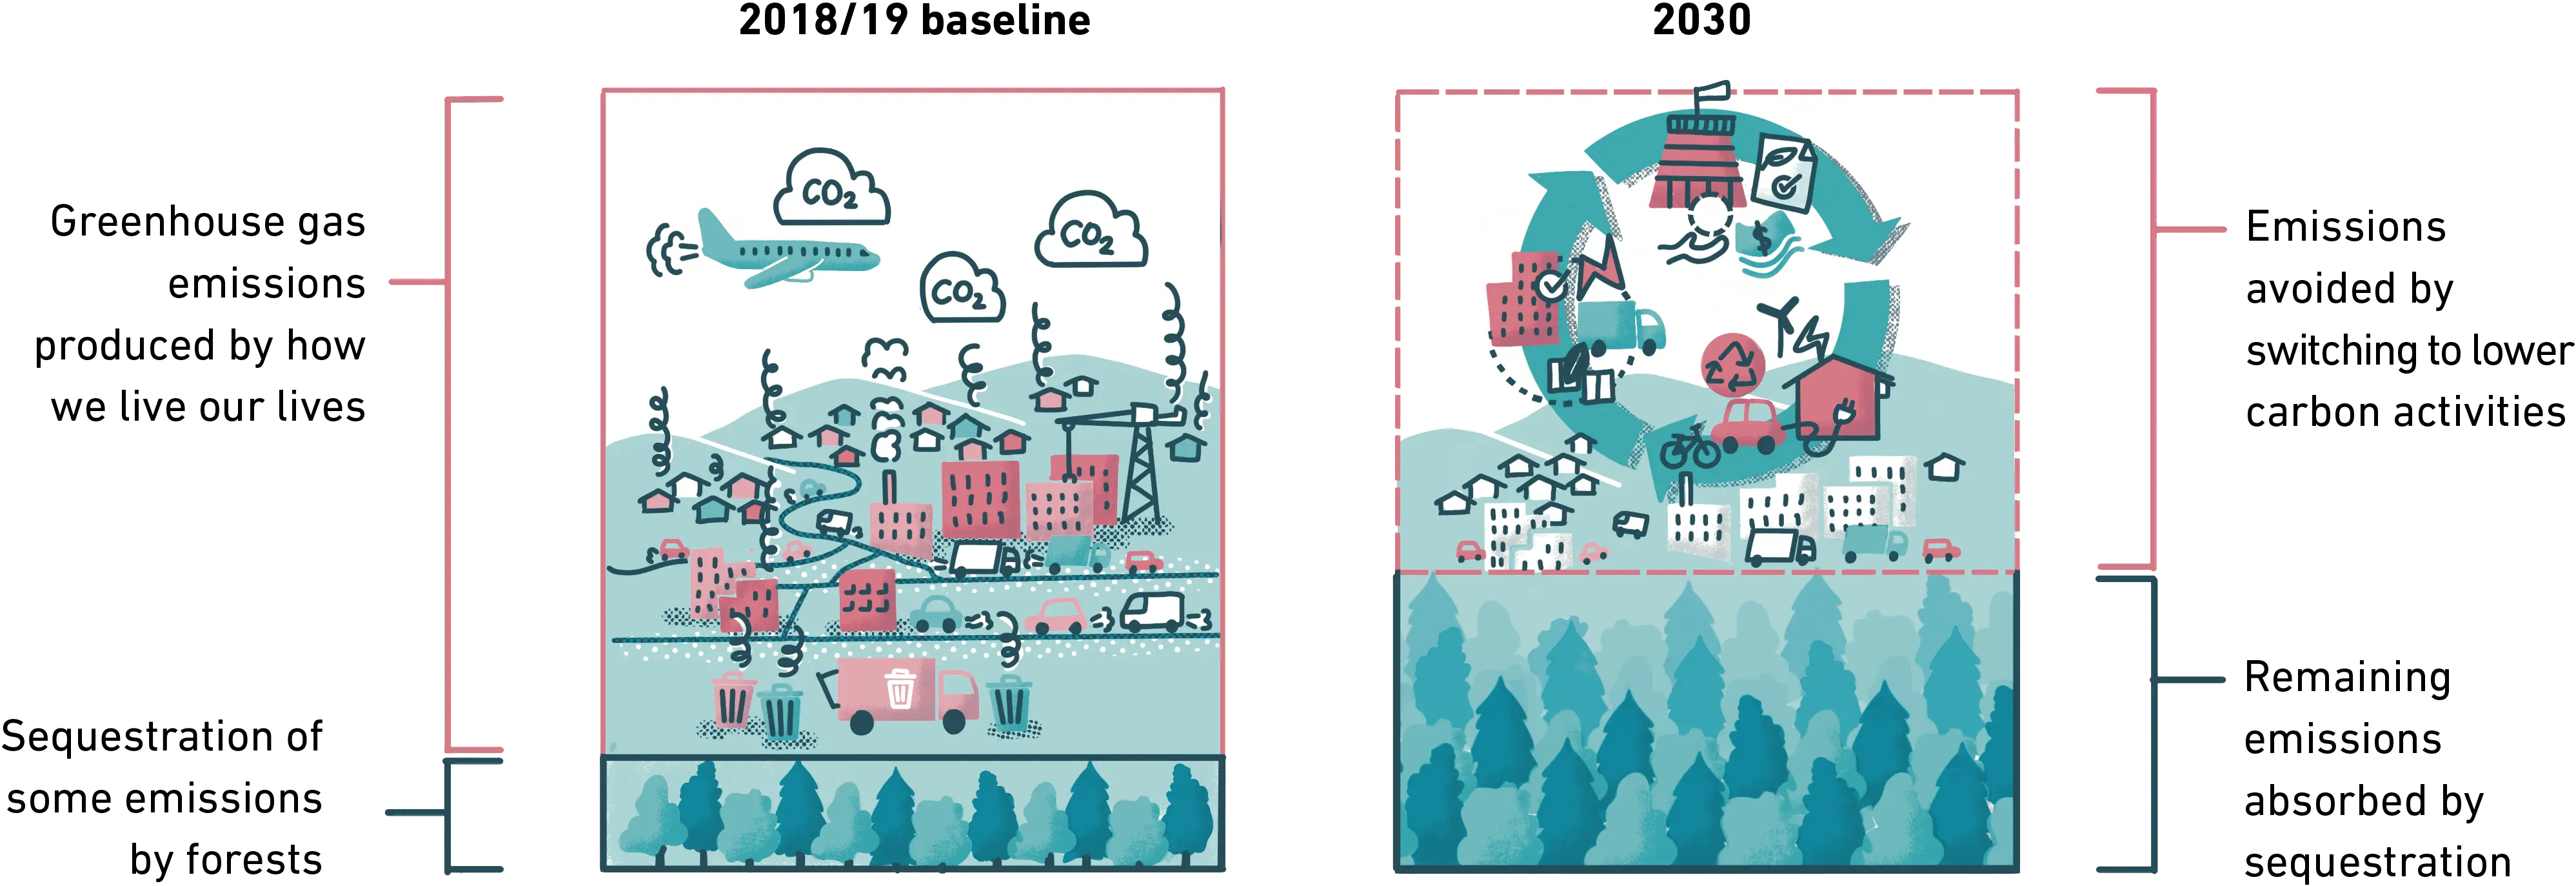
While there is a long way to go, achieving net zero emissions is possible if organisations, businesses and communities work together and collectively pull all the available levers as hard as possible.
Reducing biogenic methane emissions
The city’s biogenic methane reduction targets are the same as the central government targets:
- 10% reduction from 2017 levels by 2030
- 24-47% reduction from 2017 levels by 2050

-
Graph data
FINAL ZERO CARBON PLAN MODELLING Actuals Modelled Sector / source 2018-19 2021-22 2024-25 2027-28 2030-31 Biogenic methane Waste and Wastewater 112,473 97,567 88,321 79,496 70,974 Agriculture (Methane) 578,142 565,761 545,503 529,184 512,865 Gross biogenic methane emissions 690,615 663,328 633,824 608,680 583,839 Biogenic methane reduction target track 690,615 673,350 656,084 638,819 621,554

-
Table data
2030 Agriculture CH4 -11% (-3% between 18/19 and 21/22) Waste & wastewater -37% (-13% between 18/19 and 21/22)
By reducing emissions from the agriculture and waste sectors, a 15% reduction in biogenic methane emissions is possible by the year 2030.
Dunedin's emissions have already reduced since 2018/19. Fewer emissions are being generated, and the city's forests have grown, absorbing more carbon.
However, to achieve the two targets above (net zero carbon and reduced biogenic methane), much more needs to be done, quickly.
Dunedin's emissions
For the year 2021/22, Dunedin’s gross emissions were 1,542,500 tCO2e.
After considering carbon dioxide sequestered by forestry, our city's net emissions were 1,049,330 tCO2e.
Total Gross Emissions (excluding Forestry): 1,542,500 tCO2e
Total Net Emissions (including Forestry): 1,049,330 tCO2e
Dunedin's emissions profile
To explore how much Ōtepoti Dunedin needs to reduce emissions by to become a Zero Carbon city, a ‘baseline year’ has been used – the year against which progress is measured. For Ōtepoti Dunedin, the baseline year is 2018/19.
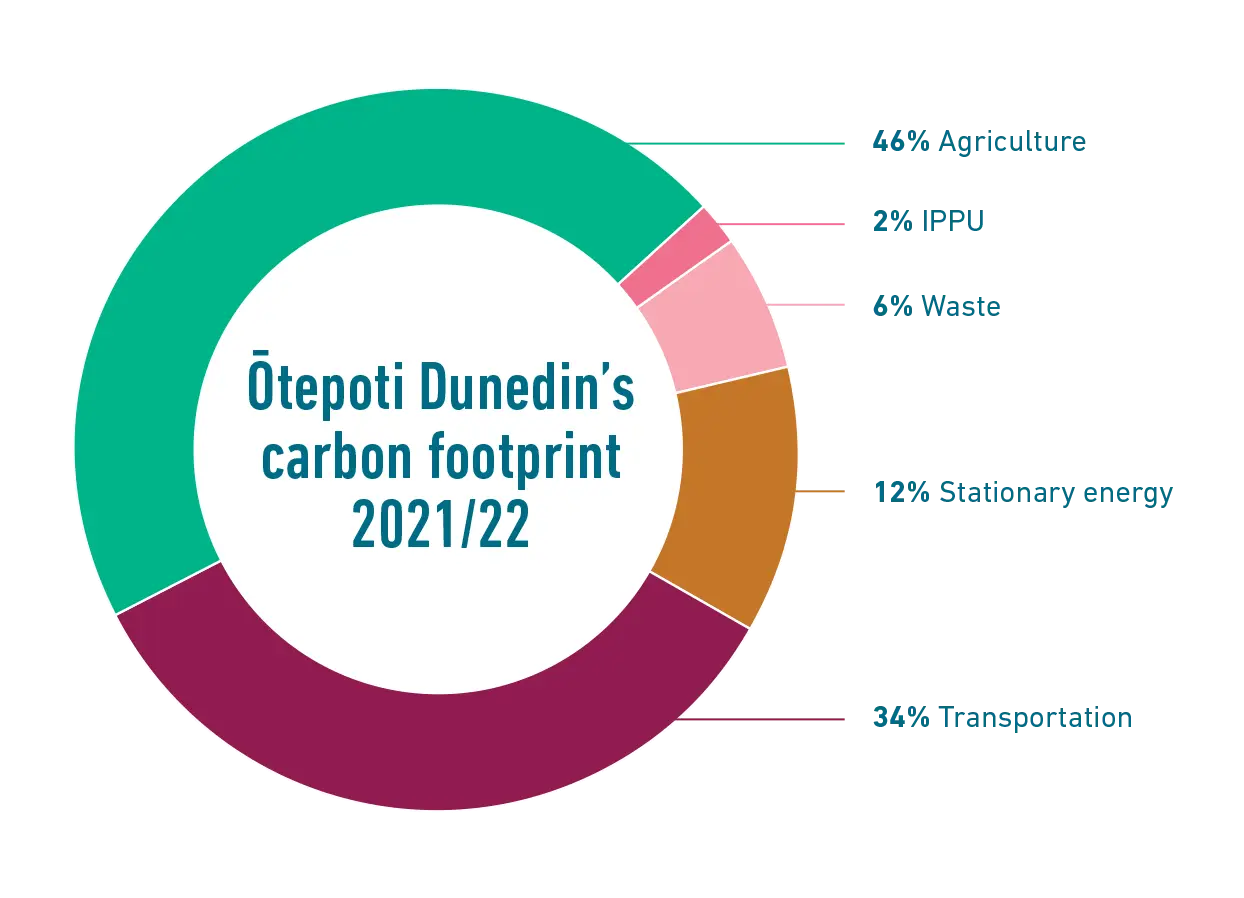
In the 2018/19 year, activities in the city generated 1,697,0002 tCO2e gross emissions, and forests absorbed 361,300 tCO2e. The DCC measured the city’s emissions again in 2021/22, and gross emissions had reduced by 9% despite the population having increased over the same period. In 2021/22, about half of Ōtepoti Dunedin’s emissions came from agriculture (46%), followed by transport (34%), stationary energy use (12%), waste (6%), and industrial processes and product use (IPPU) (2%).
Dunedin City Greenhouse Gas Emissions 2021/22
Agriculture
Made up 46% of our city's emissions
Top contributors:
- Enteric fermentation
- Manure from animals on pasture
- Other agricultural emissions
Transportation
Made up 34% of our city's emissions
Top contributors:
- Petrol and diesel
- Marine freight
- Air travel
Stationary Energy
Made up 12% of our city's emissions
Top contributors:
- Electricity consumption
- Coal
- Liquefied Petroleum Gas (LPG)
Waste
Made up 6% of our city's emissions
Top contributors:
- Open landfills
- Closed landfills
- Wastewater treatment plants
IPPU
Made up 2% of our city's emissions
Top contributors:
- Refrigerants
- Aerosols & Metered Dose Inhalers (MDI)
- SF6 electrical equipment
Forestry
Sequestered 768,455 tonnes of carbon dioxide equivalent (tCO2e)
Emitted 275,285 tCO2e through harvesting
Net forestry emissions = -493,170tCO2e
Ōtepoti Dunedin's greenhouse gas emissions % changes from 2018/19 to 2021/22
Changes in gross emissions from 2018/19 to 2021/22: -9%
- Agriculture-3%
- Transport-16%
- Stationary energy-12%
- Waste-13%
- IPPU-1%
