-
Population | Taupori
Different age groups/demographics will have different housing needs to be planned for.
Dunedin's total population over time
- Dunedin’s population of 130,480 in 2018 is projected to grow to 141,606 in 2048.
Year Population 2018 130,480 2023 134,640 2028 137,892 2033 140,535 2038 141,230 2043 141,517 2048 141,606 Source: 2020 Post Covid-19 growth projections Dunedin's age groups over time
- In 2018, 36% of Dunedin’s population is aged 25 and under, compared to 34% of NZ’s population.
- A 7% increase in Dunedin’s 65 years and over population is projected by 2048.
- A 6% decrease in the 45 – 64 age group is projected by 2048.
25 and under 25 to 44 45 to 64 65 and over 2018 36% 23% 25% 16% 2023 37% 22% 23% 18% 2028 36% 22% 21% 21% 2033 35% 23% 20% 22% 2038 34% 23% 19% 23% 2043 34% 23% 19% 24% 2048 34% 23% 19% 23% Source: 2020 Post Covid-19 growth projections Dunedin's ethnicity make up over time
- Dunedin’s population is becoming more diverse, and by 2038 Māori, Asian and Pacific people are projected to increase by 5%, 7% and 1% respectively.
European or Other Māori Asian Pacific 2013 90% 8% 7% 3% 2018 87% 9% 9% 3% 2023 85% 10% 10% 3% 2028 84% 11% 12% 3% 2033 83% 12% 13% 4% 2038 82% 13% 14% 4% Source: StatsNZ 2018 Census -
Social | Pāpori
Dunedin residents’ top five reasons for a high quality of life: Health and Wellbeing, Relationships, Financial Situation, Lifestyle, and Work.
Dunedin’s youth are far more likely to experience stress and loneliness than any other age groups.
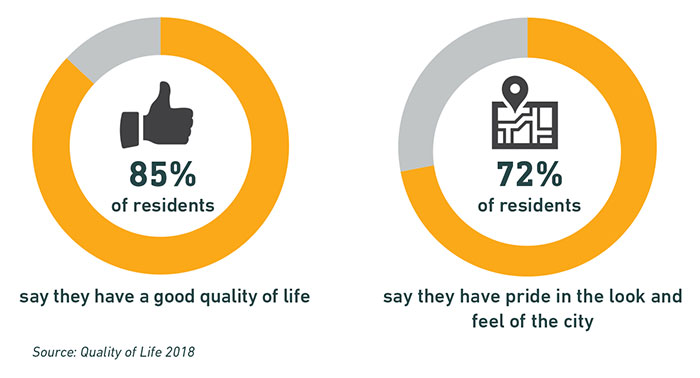
- 85% of residents say they have a good quality of life
- 72% of residents say they have pride in the look and feel of the city
Highest qualification for Dunedin resident over time
- The number of Dunedin residents with no qualification has declined by 4.8% from 2006 to 2018 and has also declined by 9.4% for Māori residents
The number of NCEA level 3 or higher education achievers has increased by 6.9% from 2006 to 2018.
Category 2006 (%) 2013 (%) 2018 (%) No qualification 21.3 18.1 16.5 Level 1 certificate 11.6 10.9 10 Level 2 certificate 9.7 9.5 9.1 Level 3 certificate 16.8 17.4 17.5 Level 4 certificate 9.9 9.7 8.8 Level 5 diploma 3.3 3.3 3.9 Level 6 diploma 4.9 4.5 4.2 Bachelor's degree 11.9 13.8 14.1 Post-graduate and honours degrees 2.7 3.6 6 Master's degree 2.5 3.1 3.9 Doctorate degree 1.6 2.1 2.4 Overseas secondary school qualification 3.8 3.9 3.5 Highest qualification for Dunedin Māori over time
Category 2006 (%) 2013 (%) 2018 (%) No qualification 25.4 20.8 16 Level 1 certificate 13.4 12.7 11.3 Level 2 certificate 10.3 11.3 11.1 Level 3 certificate 21.4 23.7 26.3 Level 4 certificate 8.5 7.9 9.4 Level 5 diploma 3.2 3.3 3.9 Level 6 diploma 2.9 2.8 2.8 Bachelor's degree 10.6 11.7 11.4 Post-graduate and honours degrees 1.8 2.4 3.9 Master's degree 1.2 1.6 2.3 Doctorate degree 0.6 1.1 0.9 Overseas secondary school qualification 0.6 0.8 0.5 Dunedin residents in full time study vs New Zealand
- 27.4% of Dunedin residents were in full-time study in 2018, more than the NZ average of 21.3%.
Category Dunedin City (%) New Zealand (%) Residents in Full-time study 27.4 21.3 Maori in Full-time study 40.7 29.9 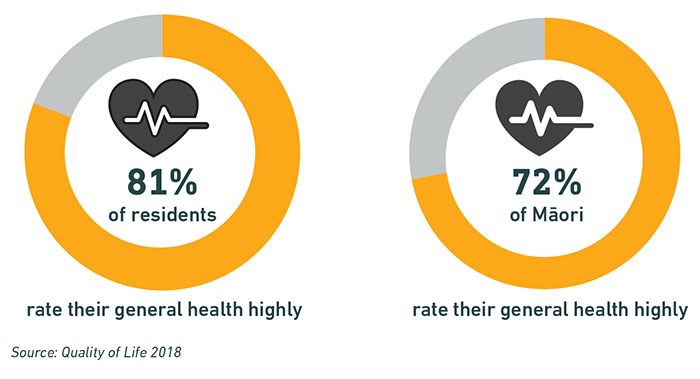
Dunedin residents rate their general health highly, but Māori residents are less likely to rate their general health as highly as the average resident.
- 85% of residents rate their general health highly
- 72% of residents rate their general health highly
-
Culture | Ahurea
Dunedin is New Zealand’s first UNESCO City of Literature. The city has three Marae, and many other locations of significance to Mana Whenua. There are 740 protected historic buildings.
Dunedin residents born overseas – country of origin
- Dunedin’s population consists of 2% Australian, 6.1% Britain and 1.4% North American born residents compared to NZ’s overall population consisting of 1.6%, 5.9% and 0.9% respectively.
- Dunedin has resettled 550 former refugees since 2016 with a majority coming from Palestine, Syria, and Afghanistan.
Dunedin City (%) New Zealand (%) Australia 2 1.6 Pacific Islands 1.1 3.7 United Kingdom 6.1 5.9 Europe 1.8 1.9 North America 1.4 0.9 Asia 5.5 10.4 Middle East and Africa 1.8 2.5 Other 0.3 0.5 Source: StatsNZ 2018 Census Major Religions
- Just over half of Dunedin residents now no longer identify with an organised religion (40.4% in 2016 vs 56% in 2018).
- Christianity remains Dunedin’s largest religious identity (32.5% in 2018), however Dunedin is also home to followers of Buddhism (0.8%), Hinduism (0.9%), Islam (1%), Judaism (0.1%) and traditional Māori beliefs (0.2%).
Religious affiliation 2006 (%) 2013 (%) 2018 (%) No religion 40.4 49.5 56 Christian 51.9 44.2 32.5 Other 9.6 8.1 11.7 Source: StatsNZ 2018 Census -
Economy | Ōhaka
Dunedin’s pre-Covid-19 economic growth was exceeding the New Zealand average. The number of people seeking unemployment support has been reducing over the past decade.
Unemployment rates have shown a decline from 8.1% in the first quarter of 2010 to 5.4% in the last quarter of 2019.
Dunedin's major employment industries 2019
- Employment in manufacturing has decreased from 9.2% in 2009 to 6% in 2019. Employment in construction has increased from 7% in 2009 to 9% in 2019.
- Retail (10.1%), Education and Training (13.5%), and Health Care and Social Assistance (14.9%) continue to be the highest employment industries in 2019.
2019 Manufacturing 6% Construction 9% Retail Trade 10.1% Accommodation and Food Services 8.3% Professional, Scientific and Technical Services 6.8% Administrative and Support Services 3.5% Public Administration and Safety 4.8% Education and Training 13.5% Health Care and Social Assistance 14.9% Other industry 23.1% Source: StatsNZ 2018 Census -
Housing | Whare
Dunedin average house price over time
- There has been a recent sharp increase in Dunedin’s housing prices. Average house price in 2010 was $276,048 versus an average in 2020 of $552,297.
- While housing affordability has been a growing issue, Dunedin house prices are still lower (25%) than the NZ average.
Quarter Amount 2010/3 $276,048 2010/9 $271,174 2011/3 $268,657 2011/9 $269,379 2012/3 $274,212 2012/9 $279,766 2013/3 $286,212 2013/9 $288,473 2014/3 $291,257 2014/9 $291,297 2015/3 $294,446 2015/9 $308,420 2016/3 $326,217 2016/9 $353,670 2017/3 $374,117 2017/9 $385,666 2018/3 $408,576 2018/9 $434,514 2019/3 $463,292 2019/9 $502,294 2020/3 $552,297 Sources: Infometrics quarterly reports Dunedin's number and value of new residential buildings over time
- There is an estimated need of 750 new domestic dwellings required to accommodate the city’s estimated annual population growth.
- Over the past 10 years, there has been an average of 372 new dwellings in Dunedin.
Year Number of new residential dwellings Value of new residential dwellings 2004 380 $78,436,488 2005 424 $89,910,866 2006 456 $100,523,998 2007 416 $100,736,766 2008 284 $67,732,633 2009 272 $68,675,700 2010 356 $78,145,476 2011 236 $56,893,907 2012 379 $88,180,447 2013 375 $99,328,490 2014 382 $107,855,805 2015 320 $101,017,150 2016 425 $139,315,600 2017 454 $151,878,900 2018 442 $159,500,200 2019 352 $136,279,170 Source: DCC Building Consents data -
Environment | Taiao
11% of Dunedin city’s land is protected under conservation value, equalling to roughly 36,000 hectares.
Dunedin has 30 native plants and species that are not found anywhere else in the world.
The entire Dunedin City area is Wahi Tupuna (ancestral landscape) as it was used and valued by mana whenua. Wahi Tupuna sites include settlements, battle sites, burial places, mahika kai areas and resources, trails and significant landscape features such as peaks.
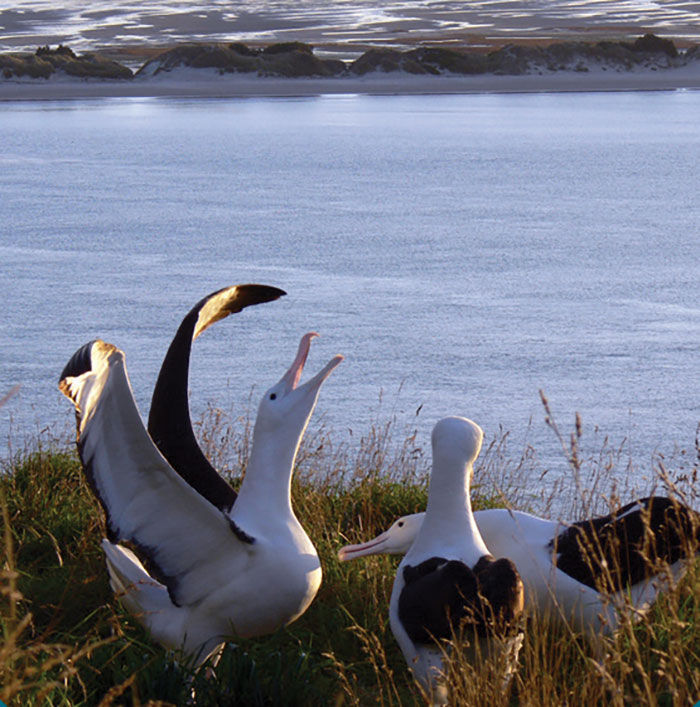
Dunedin has the world’s only mainland albatross colony
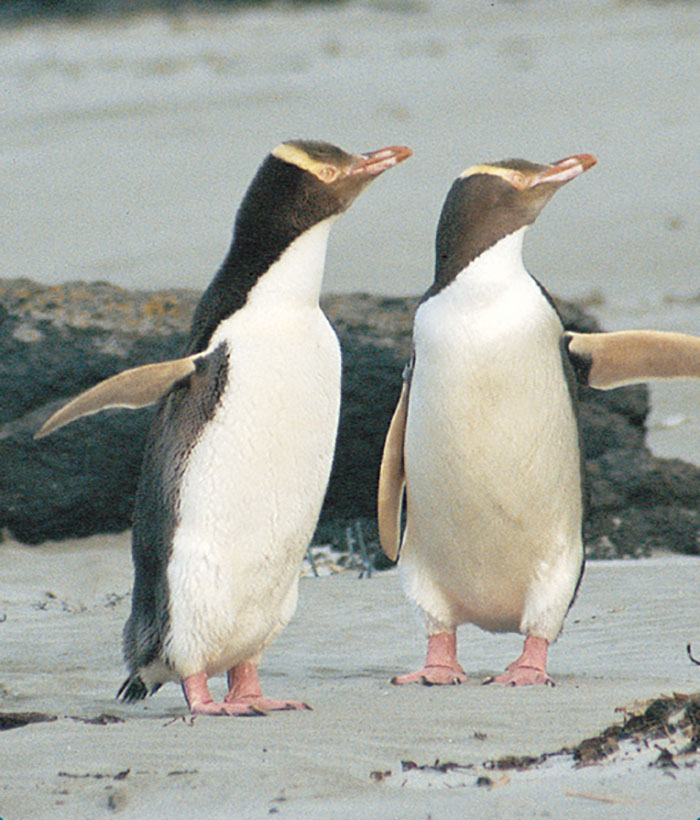
Dunedin is home to some of New Zealand’s major penguin and seal colonies
-
Climate change | Āhuaraki hurihuri
In June 2019, Dunedin City Council declared a climate emergency for Dunedin with a goal of making Dunedin city net carbon neutral by 2030.
A variety of changes in temperature, rainfall and sea level rise will impact the city and natural environment in different ways that need to be prepared for.
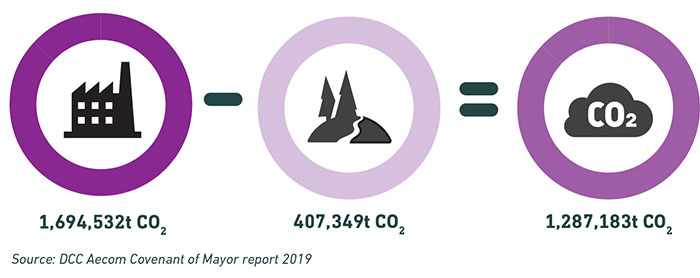
Greenhouse emissions less Sequestered emissions equals Total emissions 1,694,532t CO2 407,349t CO2 1,287,183t CO2 - Dunedin produced roughly 1.6 million tonnes of greenhouse gas emissions in 2018/19.
- Approximately 400,000 tonnes of greenhouse emissions are being sequestered through local forestry and native reserves.
- Considering sequestration, Dunedin’s total net emissions for 2018/19 is roughly 1.2 million tonnes.
Dunedin's emissions change 2015 to 2019
Agriculture Transportation Stationary Energy Waste Industry 2015 683,412 546,583 202,435 136,574 40,386 2019 599,051 712,188 199,832 122,608 39,544 Source: DCC Aecom Covenant of Mayor reports 2015 and 2019 South Dunedin is a vibrant and diverse community that over 10,000 people call home. It is flat and conveniently located, and home to many businesses, schools and critical infrastructure that residents and the wider city rely on. South Dunedin was built on land reclaimed from a coastal wetland. This means that groundwater is already close to the surface and makes it hard for water to drain away when it rains.
South Dunedin has nearly 2700 homes that lie less than 50cm above the mean spring high tide mark – more than anywhere else in New Zealand – and over 70% are less than half that elevation.
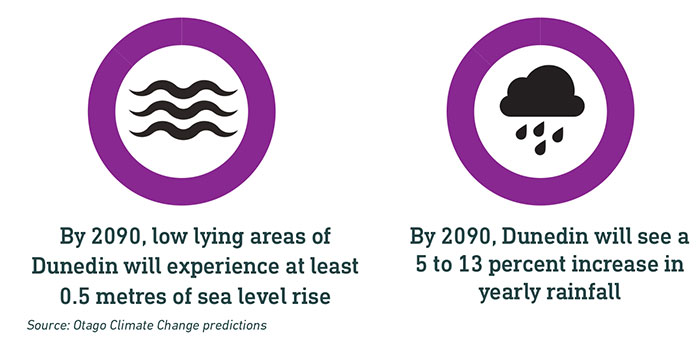
- By 2090, low lying areas of Dunedin will experience at least 0.5 metres of sea level rise
- By 2090, Dunedin will see a 5 to 13 percent increase in yearly rainfall
-
Māori in Dunedin | Ngāi māori ki ōtepoti
Māori population
Source: Stats NZ, 2018 CensusIn 2018, 11,730 people living in Dunedin identified as Māori
- 9.3% of people in Dunedin identify as Māori vs 16.5% of people in NZ identify as Māori
- 11% of people in Dunedin are of Māori descent vs 18.5% of all people in NZ are of Māori descent
Dunedin’s Māori population is younger than Dunedin’s population overall
- 29.5% of Māori people are aged less than 15 years vs 15.4% of all Dunedin people
- 4.6% of Māori people are 65 years and over vs 16.3% of all Dunedin people
Dunedin population by median age (total vs Māori)
- Median age for Māori people in Dunedin - 21.8 years
- Median age for all of Dunedin - 37 years
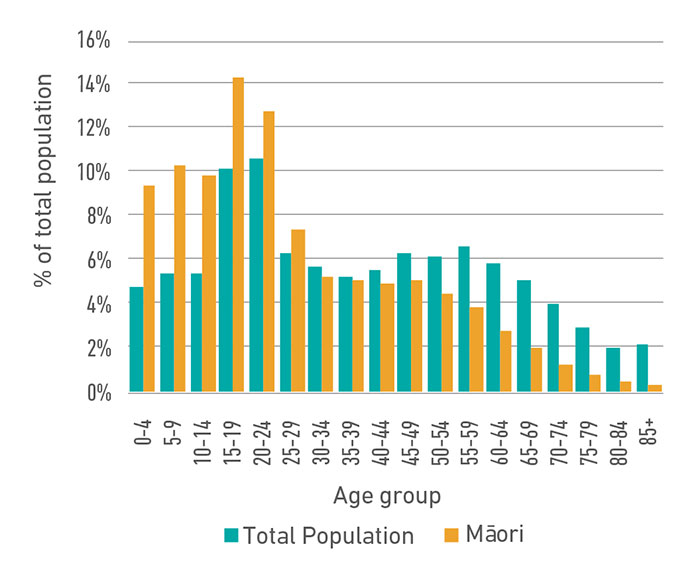
Dunedin population in 2018 by age group (total vs Māori) Age group Total Population Māori 0-4 4.76% 9.33% 5-9 5.31% 10.31% 10-14 5.33% 9.80% 15-19 10.15% 14.35% 20-24 10.66% 12.80% 25-29 6.30% 7.37% 30-34 5.63% 5.25% 35-39 5.27% 5.13% 40-44 5.45% 4.98% 45-49 6.34% 5.13% 50-54 6.21% 4.37% 55-59 6.55% 3.87% 60-64 5.78% 2.71% 65-69 5.12% 1.99% 70-74 4.05% 1.16% 75-79 2.91% 0.73% 80-84 2.01% 0.48% 85+ 2.18% 0.25% Māori cultural wellbeing
Source: Te Kupenga, Stats NZ Tatauranga Aotearoa 2018 (Otago/Southland)- 63.7% of Māori took part in the care of Māori sites of significance, with their whānau, in the last 12 months
- 35.4% of Māori took part in caring for the health of the environment, with whānau, in the last 12 months
- 21% know Marae Tupuna
- 69.5% been to Marae Tupuna in the previous 12 months
- 67.7% would like to have been to Marae Tupuna more often in the previous 12 months
Importance of using Te reo Māori in daily life Very important 8.5% Quite important 9.2% Somewhat/a little important 42.8% Not at all important 39.6% Able to speak Te reo Māori (self-rated) Very well/well 3.6% Fairly well 6.9% Not very well 27.5% No more than a few words or phrases 62.1% Whānau wellbeing where 0 is extremely bad and 10 is extremely good 0-6 23.7% 7 22.6% 8 27.2% 9 16.6% 10 9.9% Contact with non-resident whānau
- 66.3% of Māori think they have the right amount of contact with whānau
- 31.3% of Māori think they don't have enough contact with whānau
- 81.9% have face-to-face contact with non- resident whānau
- 95.8% have non-face-to- face contact with non- resident whānau
Māori educational achievement
Source: Stats NZ, 2018 Census- 57.2% of Māori in Dunedin have attained a qualification at level 3 and higher
Level of educational attainment Māori Non Māori No qualification 15% 16% Level 1 & 2 21% 18% Level 3+ 57% 58% Overseas secondary qualification 1% 3% Not elsewhere stated 6% 5% Māori economic wellbeing
Source: Stats NZ, 2018 CensusMāori people in Dunedin work in a variety of occupations
Below are some of the top occupations: Managers 11.7%5 Professionals 19.5% Technicians and trade workers 11.7% Community and personal service workers 14.2% Clerical and Admin Workers 9.6% Sales Workers 11.1% Machinery Operators and Drivers 5.5% Labourers 16.8% Personal Income for Māori over 15 in Dunedin 2018 $5,000 or less 20% $5,001 - $10,000 9% $10,001 - $20,000 21% $20,001 - $30,000 12% $30,001 - $50,000 17% $50,001 - $70,000 11% $70,001 or more 10% Māori home ownership in 2018 Own or partly own 28% Hold in a family trust 5% Don not own or hold in trust 67% Māori social wellbeing
Source: 2018 Quality of Life SurveyHow Maori in Dunedin classify their health Physical health Mental health Poor 3% 8% Fair 25% 21% Good 38% 25% Very good 25% 26% Excellent 9% 19% Source: 2020 Quality of Life Survey Sense of community experienced by Maori Strongly disagree 1% Disagree 12% Neither agree nor disagree 26% Agree 47% Strongly agree 12% Confidence in council decision-making Maori Non-Maori Strongly disagree 9% 8% Disagree 20% 18% Neither agree nor disagree 44% 34% Agree 25% 36% Strongly agree 2% 4% Trust in other people, Māori and Non-Māori Māori Non-Māori You almost always can't be too careful in dealing with people 7% 5% You usually can't be too careful in dealing with people 24% 19% People can usually be trusted 54% 60% People can almost always be trusted 12% 12% Don't know 4% 5% Participation with iwi Yes No Registered with iwi 54% 46% Eligible to vote in last iwi elections (if registered) 75% 25% Voted in an iwi election in the last three years (if eligible) 31% 69% Source: Te Kupenga, Stats NZ Tatauranga Aotearoa 2018 (Otago/Southland) -
Pāsifika in Dunedin | Ngāi Pāsifika ki ōtepoti
Pāsifika population
2Source: Stats NZ, 2018 Census4,026 people living in Dunedin in 2018 identified as Pāsifika
- 3% of people in Dunedin identify as Pāsifika vs 8% of people in New Zealand identify as Pāsifika
- 4.6% of Pāsifika people are 65 years and over vs 16.3% of all Dunedin people
Dunedin’s Pāsifika population is younger than Dunedin’s population overall
- 29.3% of Pāsifika people are aged less than 15 years vs 15.4% of all Dunedin people
Dunedin population by median age (total vs Pāsifika)
- Median age for Pāsifika people in Dunedin - 21 years
- Median age for all of Dunedin - 37 years
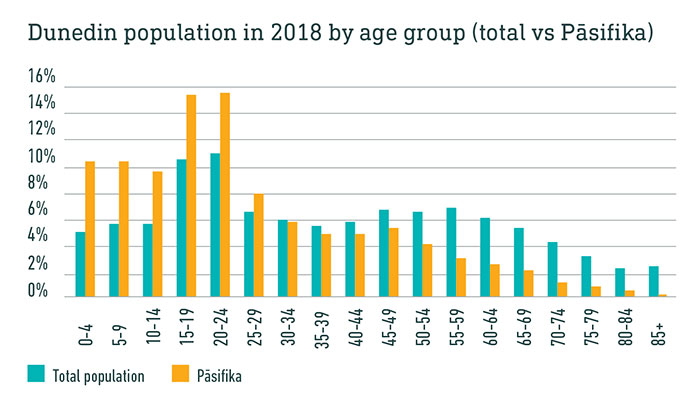
Dunedin population in 2018 by age group (total vs Pāsifika) Age group Total people Pāsifika 0-4 4.8% 9.9% 5-9 5.3% 10.0% 10-14 5.3% 9.3% 15-19 10.2% 15.0% 20-24 10.7% 15.1% 25-29 6.3% 7.6% 30-34 5.6% 5.5% 35-39 5.3% 4.6% 40-44 5.4% 4.5% 45-49 6.3% 5.1% 50-54 6.2% 3.8% 55-59 6.6% 2.8% 60-64 5.8% 2.3% 65-69 5.1% 1.9% 70-74 4.0% 1.0% 75-79 2.9% 0.7% 80-84 2.0% 0.4% 85+ 2.2% 0.1% Pāsifika educational achievement
Source: Stats NZ, 2018 Census56.4% of Pāsifika in Dunedin have attained a qualification at level 3 and higher
Highest qualifications obtained by Pāsifika and non-Pāsifika No Qualification Level 1 & 2 Level 3+ Overseas Secondary Qualification Not elsewhere stated Pāsifika 16% 22% 56.4% 6% 8% Non-Pāsifika 17% 19% 61% 4% 5% Pāsifika economic wellbeing
Source: Stats NZ, 2018 CensusPersonal income of Dunedin Pāsifika $5,000 or less 25% $5,001-$10,000 9% $10,001-$20,000 18% $20,001-$30,000 11% $30,001-$50,000 21% $50,001-$70,000 10% $70,001 or more 6% Dunedin Pāsifika home ownership in 2018 Hold in a family trust 3% Own or partly own 16% Do not own and do not hold in a family trust 61% Not elsewhere included 20%
Current Alerts and Notices (View all)

Snapshot of a great small city | He tirohaka o te tāone
Last updated: 03 Apr 2023 1:41pm
