For the year 2021/22, Dunedin’s gross emissions were 1,542,500 tCO2e.
After considering carbon dioxide sequestered by forestry, our city's net emissions were 1,049,330 tCO2e.
Total Gross Emissions (excluding Forestry): 1,542,500 tCO2e
Total Net Emissions (including Forestry): 1,049,330 tCO2e
Dunedin's emissions profile


To explore how much Ōtepoti Dunedin needs to reduce emissions by to become a Zero Carbon city, a ‘baseline year’ has been used – the year against which progress is measured. For Ōtepoti Dunedin, the baseline year is 2018/19.
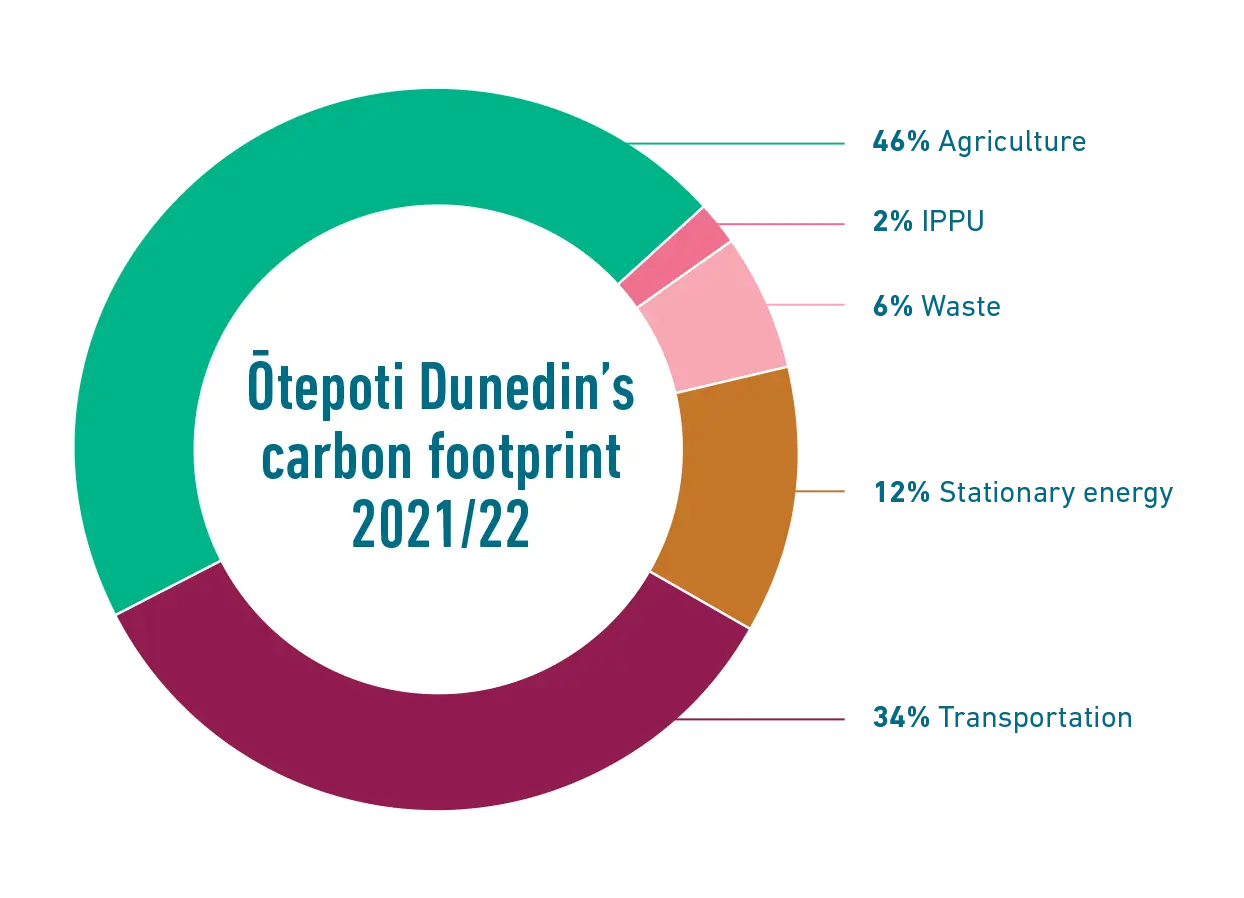
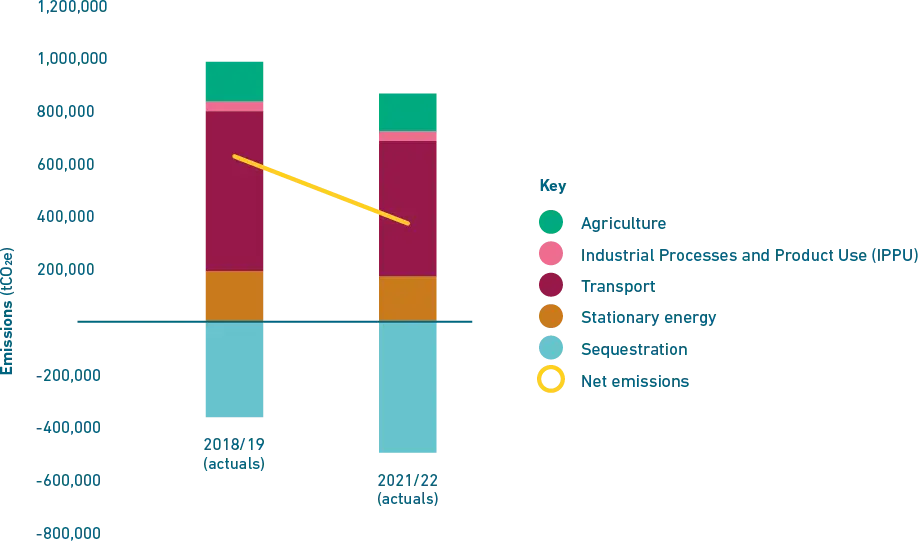
In the 2018/19 year, activities in the city generated 1,697,0002 tCO2e gross emissions, and forests absorbed 361,300 tCO2e. The DCC measured the city’s emissions again in 2021/22, and gross emissions had reduced by 9% despite the population having increased over the same period. In 2021/22, about half of Ōtepoti Dunedin’s emissions came from agriculture (46%), followed by transport (34%), stationary energy use (12%), waste (6%), and industrial processes and product use (IPPU) (2%).
Dunedin City Greenhouse Gas Emissions 2021/22
Agriculture
Made up 46% of our city's emissions
Top contributors:
- Enteric fermentation
- Manure from animals on pasture
- Other agricultural emissions
Transportation
Made up 34% of our city's emissions
Top contributors:
- Petrol and diesel
- Marine freight
- Air travel
Stationary Energy
Made up 12% of our city's emissions
Top contributors:
- Electricity consumption
- Coal
- Liquefied Petroleum Gas (LPG)
Waste
Made up 6% of our city's emissions
Top contributors:
- Open landfills
- Closed landfills
- Wastewater treatment plants
IPPU
Made up 2% of our city's emissions
Top contributors:
- Refrigerants
- Aerosols & Metered Dose Inhalers (MDI)
- SF6 electrical equipment
Forestry
Sequestered 768,455 tonnes of carbon dioxide equivalent (tCO2e)
Emitted 275,285 tCO2e through harvesting
Net forestry emissions = -493,170tCO2e
Ōtepoti Dunedin's greenhouse gas emissions % changes from 2018/19 to 2021/22
Changes in gross emissions from 2018/19 to 2021/22: -9%
- Agriculture-3%
- Transport-16%
- Stationary energy-12%
- Waste-13%
- IPPU-1%

