Te hākai ki te tahua pūtea - How it works financially
Our last 10 year plan 2021-31 was prepared in the context of the Covid 19 pandemic and we now face different financial challenges and economic pressures. High inflation and increasing costs have had an impact on the DCC’s finances – it now costs more to deliver the same essential services.
The Government introduced a new reform programme, called ‘Local Water Done Well’, which has required the DCC to reassess how it would intend to deliver water services. For the Council, the provision of water services remains a priority. This 9 year plan has been prepared with three waters services included, while continuing to work on how this service will be delivered in the future.
In the last four years, we have invested substantially in infrastructure to build resilience and cater for the projected population growth. Increasing investment in the maintenance and renewal of our infrastructure networks ensures the reliability of essential assets and services.
Operating budgets
Our operating budgets provide for the day-to-day running of all the activities and services the DCC provides to its community. These include three waters services, parks, pools, galleries, libraries and roading.
Balanced budget
The revaluation of three waters infrastructure assets in 2022/23 resulted in a significant increase in depreciation. Since this time, Council has budgeted an operating deficit. The 9 year plan provides for the Council achieving an operating surplus by year two of the 9 year plan.
In our deficit year Council will be borrowing more. Council believes this is financially prudent because it balances affordability and delivery, and it is demonstrating that a balanced budget will be achieved early in the 9 year plan.
The Council aims to ensure a balanced budget, meaning everyday costs of running the city can be funded from everyday revenue (excluding any non- recurring/non-cash items).
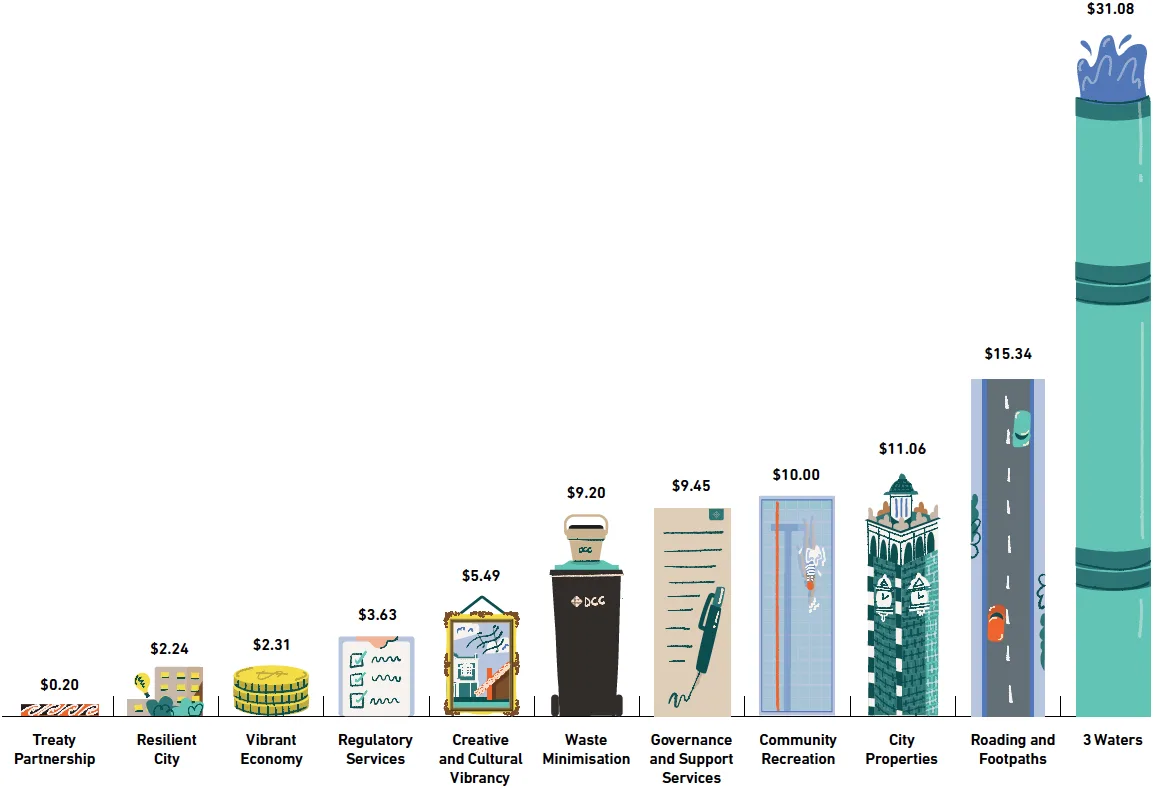
The following chart demonstrates the allocation of expenditure for every $100 of operational expenditure.

-
Allocation of expenditure table
The allocation of expenditure for every $100 of operational expenditure Treaty Partnership $0.20 Resilient City $2.24 Vibrant Economy $2.31 Regulatory Services $3.63 Creative and Cultural Vibrancy $5.49 Waste Minimisation $9.20 Governance and Support Services $9.45 Community Recreation $10.00 City Properties $11.06 Roading and Footpaths $15.34 3 Waters $31.08
Rates
Rates are a key source of funding for Council services, and we are aiming to balance the increasing cost of delivering core services with affordability for our ratepayers.
Our proposed work programmes and capital projects are designed to balance increasing costs and affordability. In the first year of the 9 year plan, we are planning to increase our overall rates revenue by $25 million. This is an increase of 10.5% from the 2024/25 year. The rates increase does not deliver a balanced budget but provides for an improved net deficit of $3.682 million.
The 10.5% rate increase for 2025/26 includes both the general rate and targeted rates. It includes an increase of 15% to both the water and the drainage targeted rates as we work towards having the cost of providing our water services being fully funded by targeted rates. A similar increase is planned for 2026/27 to achieve this. The rate increase also includes a 15.4% increase in the kerbside collection targeted rate that reflects the increase in collection costs.
We have set the following limits for rate increases over the term of the 9 year plan:
- Years 1-3: limited to no more than 12% per annum
- Year 4: limited to no more than 8% per annum
- Years 5-6: limited to no more than 7% per annum
- Years 7-9: limited to no more than 6% per annum.
We know higher rates can be harder for people to afford, particularly those on a fixed income but we need to increase rates to provide essential city services and deliver projects our community wants. The central government offers a rates rebate scheme for residents on low incomes to offset the cost of rates. We also have rates remission and rates postponement policies to support ratepayers.
The rates you pay are related to the capital value (CV) of your property. The increase of 10.5% will affect rate accounts differently due to the mix of CV based rates and fixed rates. The following table shows what the proposed rates rise in 2025/26 means for a selection of different properties.
Forecast rate limits and increases included in the 9 year plan
| Type of Property | CV | 2024/25 Rates $ (GST incl.) | 2025/26 Rates $ (GST incl.) | Increase $ | Increase % |
|---|---|---|---|---|---|
| Residential | |||||
| 430,000 | 3,021 | 3,346 | 325 | 10.8% | |
| 590,000 | 3,481 | 3,838 | 357 | 10.3% | |
| * 658,445 | 3,678 | 4,049 | 371 | 10.1% | |
| 750,000 | 3,942 | 4,331 | 389 | 9.9% | |
| 910,000 | 4,402 | 4,823 | 421 | 9.6% | |
| Commercial | |||||
| 690,000 | 8,214 | 9,008 | 794 | 9.7% | |
| * 2,155,224 | 23,760 | 25,996 | 2,236 | 9.4% | |
| 6,740,000 | 72,405 | 79,152 | 6,747 | 9.3% | |
| Farmland (General and community services rates only) | |||||
| * 1,668,999 | 3,957 | 4,228 | 271 | 6.8% | |
| 4,010,000 | 9,344 | 9,990 | 646 | 6.9% | |
| 10,020,000 | 23,173 | 24,780 | 1,607 | 6.9% | |
| Lifestyle (General, community services and kerbside collection rates only) | |||||
| 625,000 | 2,126 | 2,291 | 165 | 7.8% | |
| 840,000 | 2,714 | 2,920 | 206 | 7.6% | |
| * 1,158,802 | 3,585 | 3,852 | 267 | 7.4% | |
| *Average value in the type of property | |||||
Our funding sources
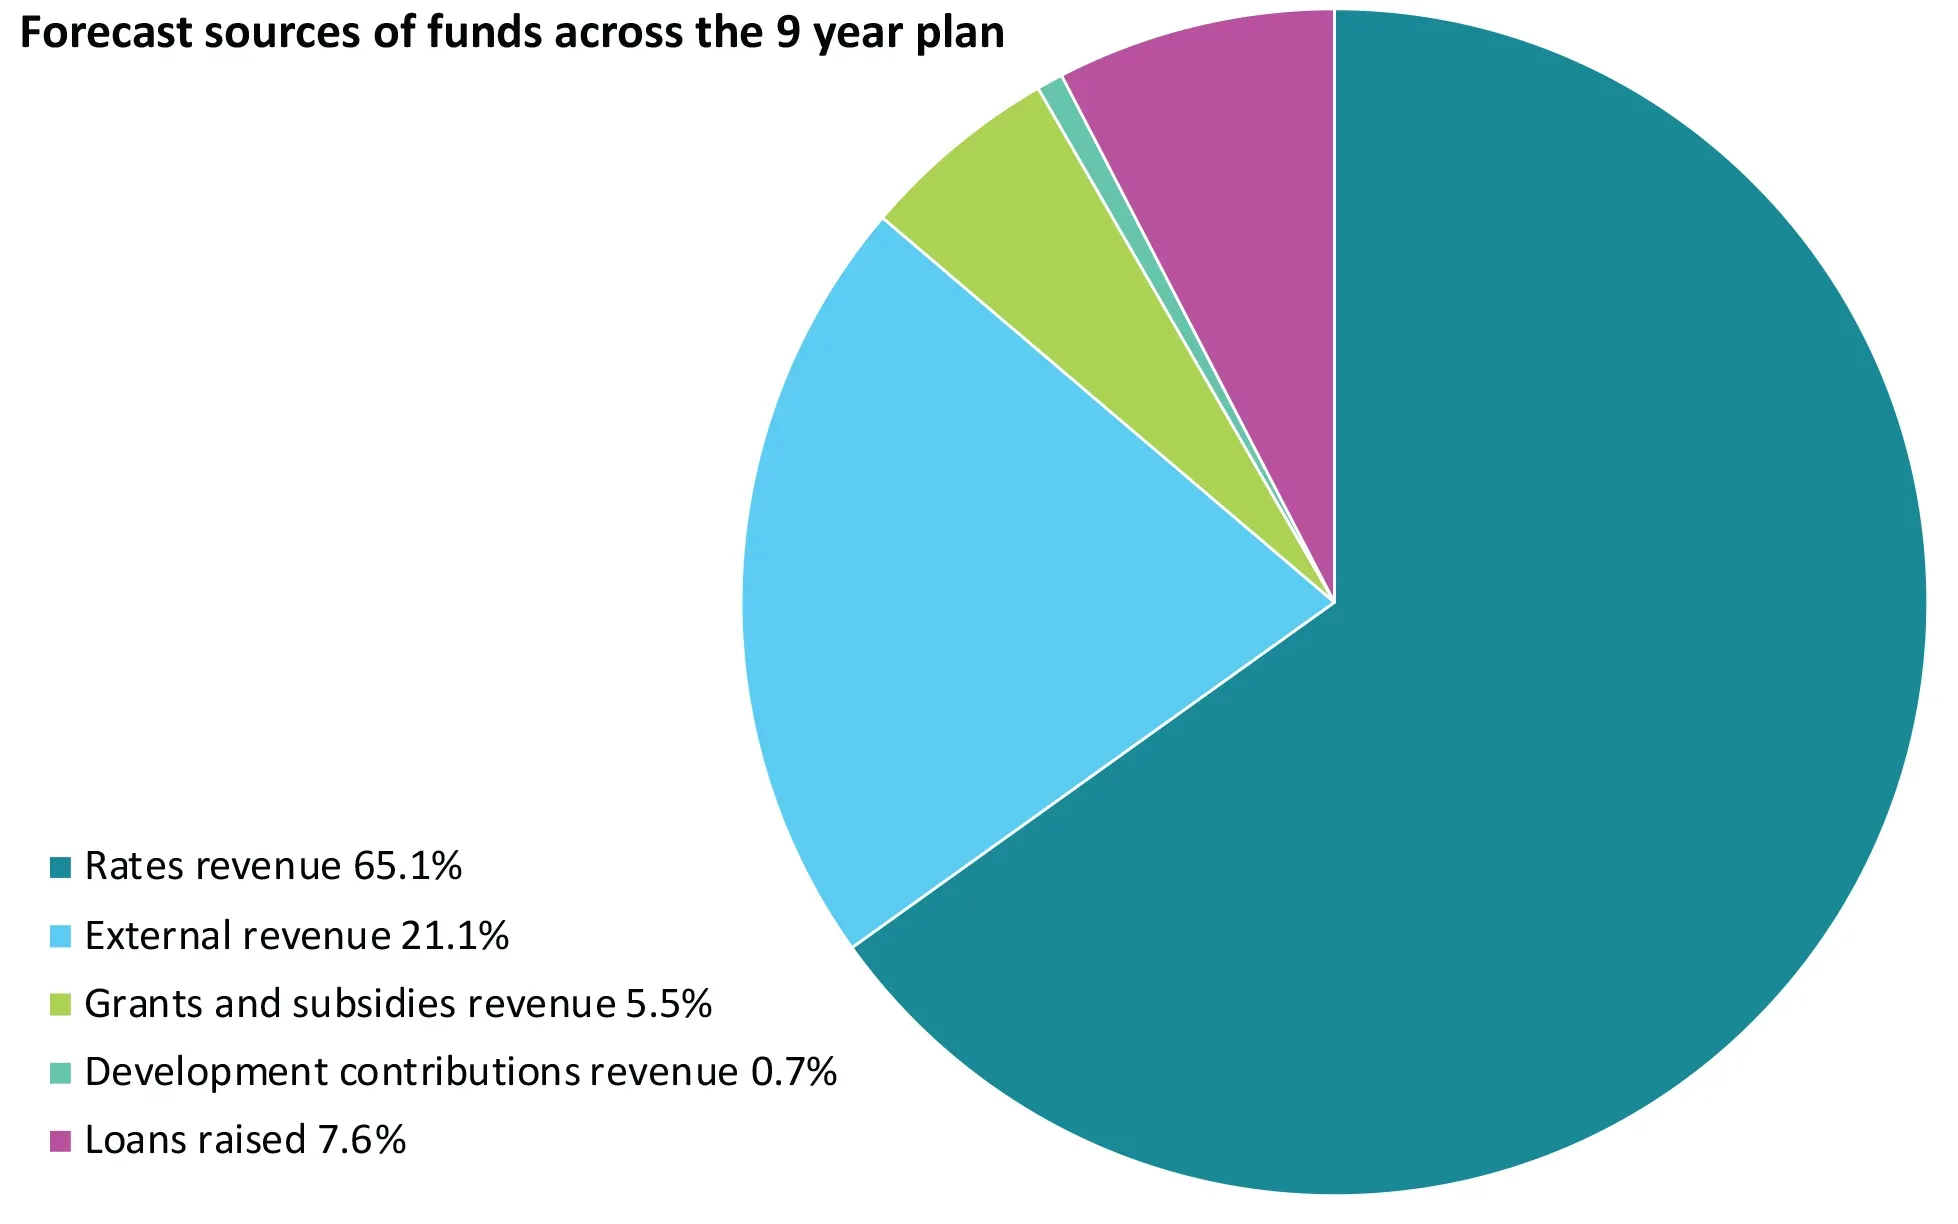
The DCC gets its money from a range of sources. About 65% comes from your rates, with the rest from fees, charges, rents, subsidies and grants as well as money from Council- owned companies.
The chart below shows the sources of revenue funding the Council’s work across the 9 year plan.

-
Our funding sources table
Forecast sources of funds across the 9 year plan Rates revenue 65.10% External revenue 21.10% Grants and subsidies revenue 5.50% Development contributions revenue 0.70% Loans raised 7.60%
Capital expenditure
Our proposed draft capital budget of $1.889 billion is made up of $1.099 billion for renewals, $719 million for new capital to improve levels of service, and $71 million for growth expenditure. Of the renewals budget, $867 million is provided to replace key three waters and transport infrastructure, building the resilience of these essential assets. This capital investment will increase operational costs for maintenance, depreciation, and interest costs on the debt required to fund the capital programme.
Investing the right way
In putting together our 9 year plan capital expenditure programme, we’ve considered:
- our assets and their condition
- prioritising replacing things over new projects
- possible impacts on climate change and zero carbon targets
- what we’re required to do by law
- our ability to deliver – internal and external resources
- how we can pay for the work.
To keep a balance between what we need to do and affordability, we have excluded or rephased some projects over the nine years.
Capital spending on our assets over the 9 year plan years ending 30 June
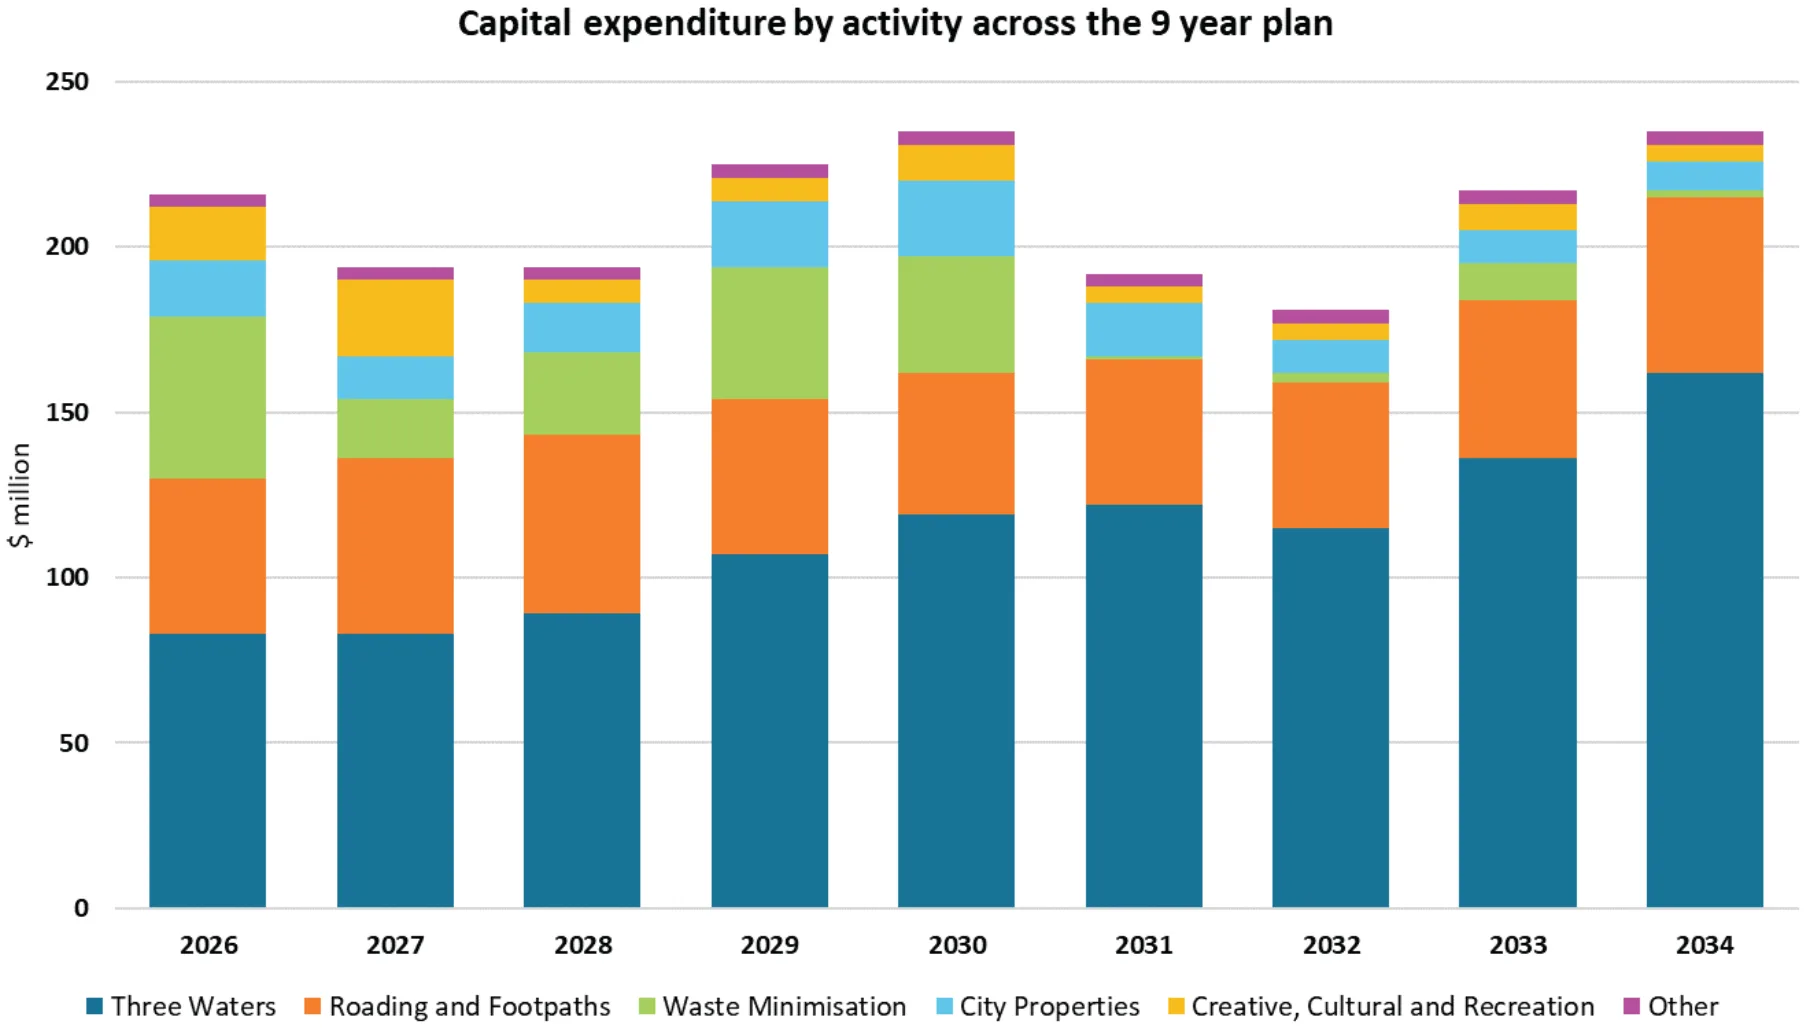
This chart shows how much we plan to spend on replacing and improving things and providing for growth in Ōtepoti Dunedin.

-
Capital expenditure table
Capital Expenditure by Activity Across the 9-Year Plan (in $ million)
Activity 2026 2027 2028 2029 2030 2031 2032 2033 2034 Total City Properties 17 13 15 20 23 16 10 10 9 133 Community Recreation 14 21 5 4 9 3 3 6 3 68 Creative and Cultural Vibrancy 2 2 2 3 2 2 2 2 2 19 Governance and Support Services 4 4 3 3 3 3 3 3 3 29 Regulatory Services 0 0 0 0 0 0 0 0 0 0 Resilient City 0 0 0 1 1 1 1 0 0 4 Roading and Footpaths 47 53 54 47 43 44 44 48 53 433 Three Waters 83 83 89 107 119 122 115 136 162 1,016 Vibrant Economy 0 0 0 0 0 0 0 0 0 0 Waste Minimisation 49 18 25 40 35 1 3 11 2 184
Debt
We use debt to spread the financial burden of new capital expenditure across a number of years. Because assets have a long life and benefit both current and future generations, debt funding means that future users of an asset pay their fair share.
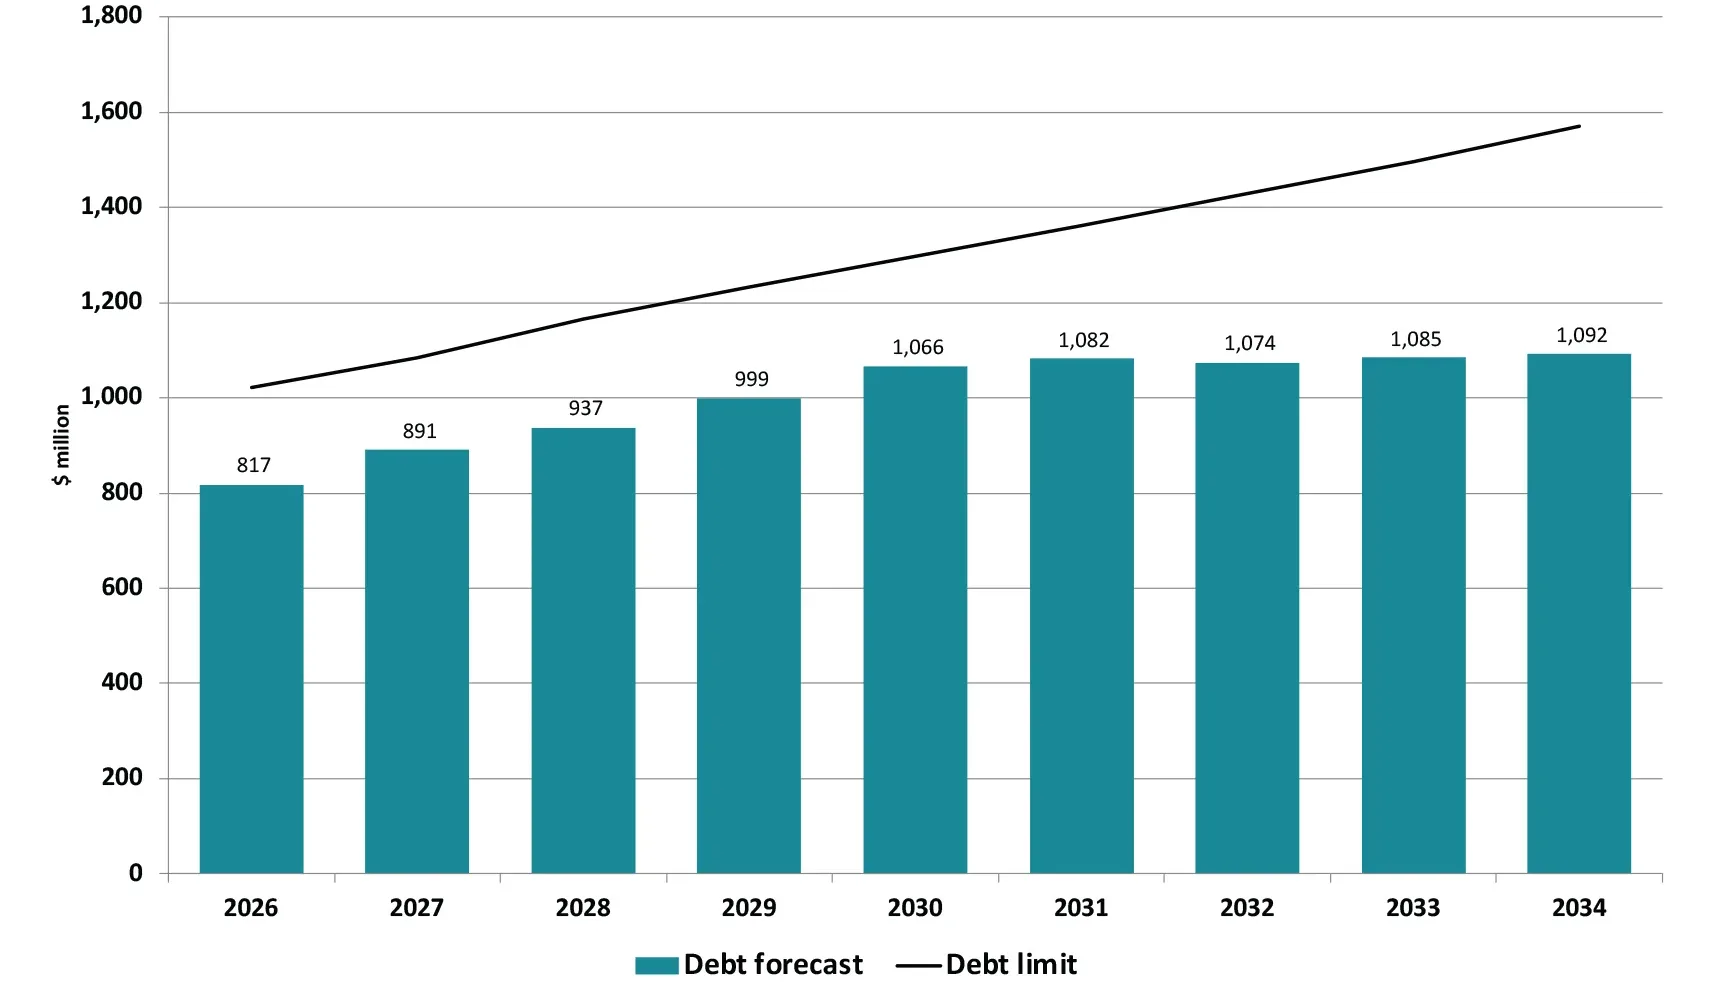
Our proposed borrowing during this 9 year plan is within our debt limit of 250% of revenue, less investment property gains. By 30 June 2034, the estimated debt level will be $1.092 billion, or 174% of revenue. This is an increase of $275 million over the 9 year period. Keeping the debt level under our debt limit means we can deliver our planned capital expenditure while also having the capacity to fund unplanned events if we need to.
The chart below shows the forecast debt and debt limits included in the 9 year plan.

-
Forecast debt and debt limits table
Year Debt forecast ($ million) Debt limit ($ million) 2026 817 1,021 2027 891 1,083 2028 937 1,165 2029 999 1,233 2030 1,066 1,297 2031 1,082 1,363 2032 1,074 1,430 2033 1,085 1,497 2034 1,092 1,571
Every year we undertake a review of our fees and charges. This year, we are proposing to increase fees to reflect the increase in costs from our 2024/25 year. Some changes to fees we are proposing include:
Sunday parking
In this 9 year plan, we are proposing to introduce fees for parking on Sundays. This initiative is designed to support our central city business community and help ensure compliance with posted time limits while increasing parking turnover. This is estimated to provide us with an increase in revenue of $150,000 per annum.
Parking
In 2023 we simplified parking zones into an inner and outer zone and adjusted our fees at that time. Along with parking fee increases, we are also proposing amending our parking fees to improve consistency between our zones and parking types. We are budgeting an increase in
revenue of $1.2 million for parking. This includes revenue from the new Pacific Radiology carpark, changes in pricing and better information about the occupancy of our parking spaces.
Sports fields
We are proposing to increase sports field fees and charges so that we recover 5% of the cost from our sports field users, rather than the 4% we recovered previously. This is estimated to provide us with an increase of revenue of $59,500 per annum.
Full details of all of our proposed fees and charges for the 2025/26 year can be found on the fees and charges page.
Grants review
The DCC grants budget in the 2024/25 financial year totalled $13.6 million. We are currently undertaking a review of our grants, that will cover around $6.6 million of grants funding that we provide to community groups and other organisations. The remaining $7 million of the total grants funding of $13.6 million is paid to Tūhura Otago Museum, Dunedin Venues Management Ltd. and the Forsyth Barr Stadium, and is not covered in the review.
Grants allocation
Grants are currently allocated through a variety of ways, for example, through applications to our Grants Subcommittee, and through service level agreements, community service agreements and property arrangements.
We want to better understand all the ways grants are allocated so we can make sure that the different processes for allocating funding are transparent, fair and align with Council’s strategic goals for Ōtepoti Dunedin.
Grants funding
Most of our grants are funded by rates, so it is very important that we are fully accountable for how that money is used and where it goes. As part of our review, we plan to bring the different processes for applying for DCC grants into line.
While we undertake this review, we have decided to keep the amount of money we provide in grants for the 2025/26 year the same as the 2024/25 year (excluding the grant paid to Tūhura Otago Museum which we propose to increase by 2.1%).
Much of this money is already committed to community group project grants, but in some instances, those grants end on 30 June 2025. This leaves some unallocated grant money that community groups would still be able to apply for through this 9 year plan’s submission process.
